
Figure 4.
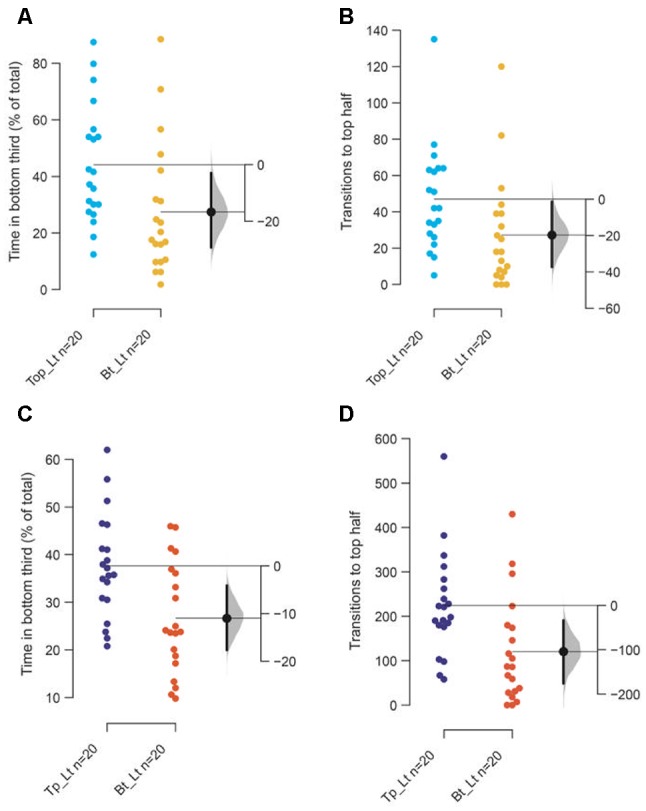
Reasons for attenuated response. The mean difference between top lit and bottom lit groups are shown in Gardner-Altman estimation plots. The (A) total percentage of time in the bottom third of the tank and (B) the frequency of transitions to the top of the tank among 3–5-month-old adults. The (C) total percentage of time in the bottom third of the tank and (D) the frequency of transitions to the top of the tank among 7–9 months or older adults. Each dot in the group represents the response of one individual. N = 20 per group. Groups are plotted on the left axes, while the mean difference between the groups is depicted as a black dot and is plotted on a floating axis on the right. Ends of the bar around the mean shows 95% confidence interval. The shaded region in gray is the 5,000 bootstrap sampling distribution.