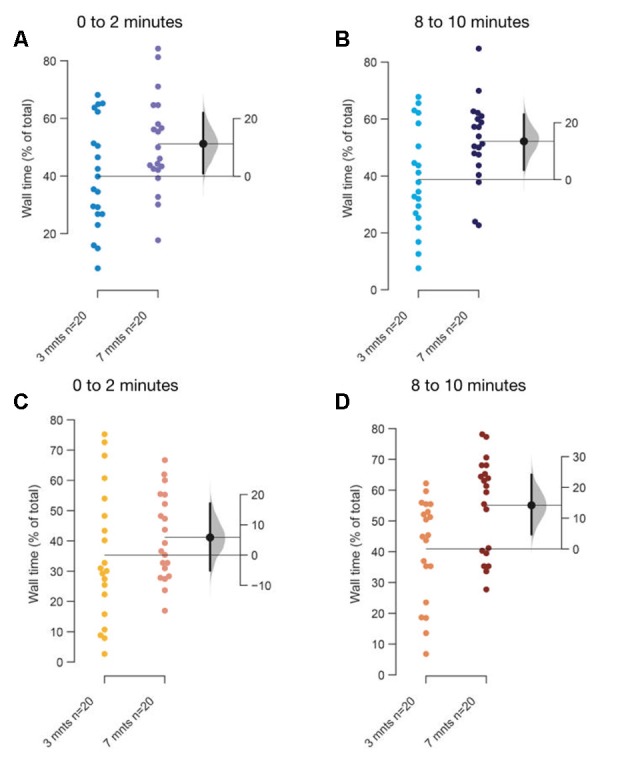
Figure 6.

Age-dependent differences in thigmotaxis. The mean difference between 3–5 months and 7–9 months fish when tanks are top lit (A,B), or bottom lit (C,D) are shown in Gardner-Altman estimation plots. The percentage of total time along the edges of the tank in (A) first 2-min, and in (B) last 2-min when tanks are lit from the top. The percentage of total time along the edges of the tank in (C) first 2-min, and in the (D) last 2-min when tanks are bottom lit. Each dot in the group represents the response of one individual. N = 20 per group. Groups are plotted on the left axis, while the mean difference between the groups is depicted as a black dot and is plotted on a floating axis on the right. Ends of the bar around the mean shows 95% confidence interval. The shaded region in gray is 5,000 bootstrap sampling distribution.
