FIGURE 6.
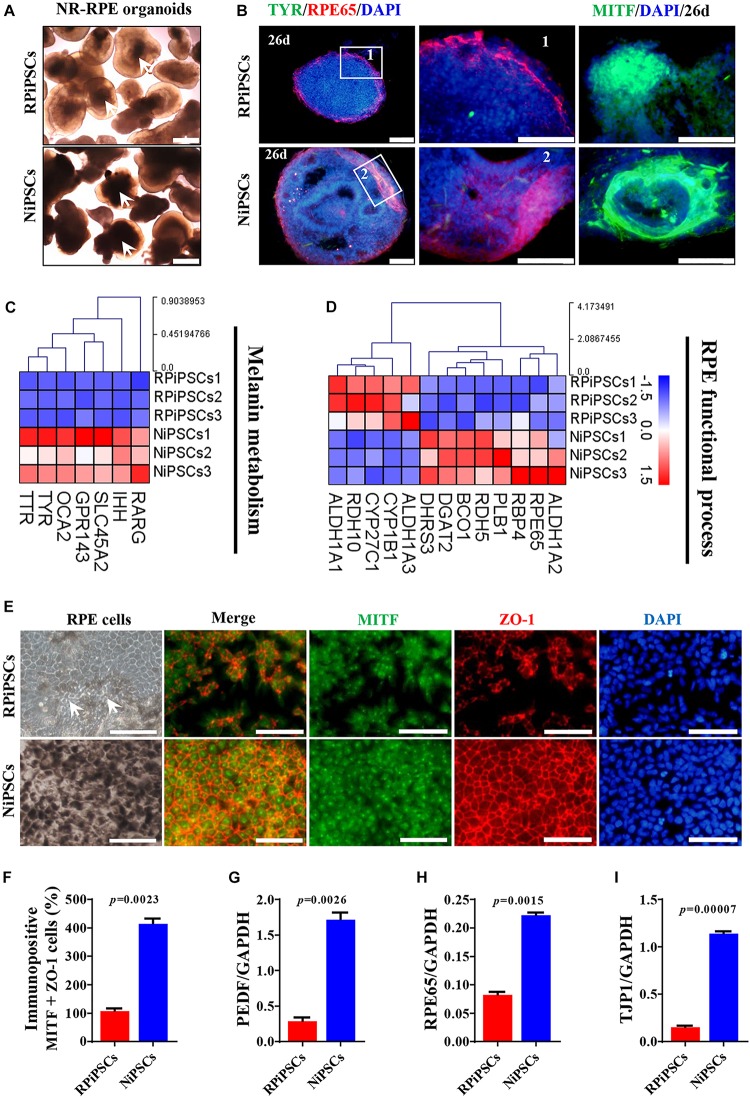
USH2A mutation iPSCs generate abnormal RPE development and growth. (A) Brightfield images of developing NR-RPE organoids at day 34. (B) Immunostaining of NR-RPE organoids showing the expression of RPE cell specific markers TYR, RPE65, and MITF. (C,D) Melanin metabolism and RPE functional process related DEGs at day 34 were picked and normalized by Z-scores. Red represents upregulated expression, blue represents downregulated expression, Bar is represents Z-score. (E) Immunostaining of RPE cells derived from NR-RPE organoids showing the expression of RPE cell specific markers MITF and ZO-1. (F) A separate bar graph shows the percentage of MIFT+ ZO-1+ cells for immunostaining in a merged image. (G–I) qPCR analysis revealed mRNA levels of RPE cell specific markers PEDF, RPE65, and TJP1 (GAPDH gene as a control). (n = 3 independent experiments; each experiment need 2–4 organoids. Scar bar = 100 μm).

