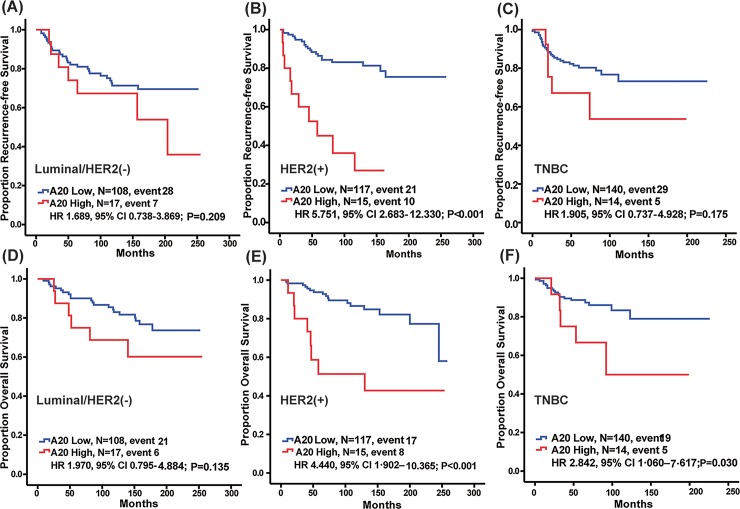
Fig 2. Kaplan-Meier plots of RFS and OS according to A20 expression level in each subtype.
RFS differed significantly according to A20 expression in the HER2 subtype (Fig B; HR 5.751, 95% CI 2.683–12.330, P < 0.001, respectively, log-rank test), but it did not differ in the other subtypes (Fig A, Luminal/HER2 negative, HR 1.689, 95% CI 0.738–3.869, P = 0.209; Fig C, TNBC, HR 1.905, 95% CI 0.737–4.928, P = 0.175). OS differed significantly according to A20 expression in the HER2 and TNBC subtypes (Fig E; HER2, HR 4.440, 95% CI 1.902–10.365, P < 0.001, Fig 2F; TNBC, HR 2.842, 95% CI 1.060–7.617, P = 0.030), but it did not differ in luminal/HER2 negative (Fig D; HR 1.970, 95% CI 0.795–4.884, P = 0.135).

