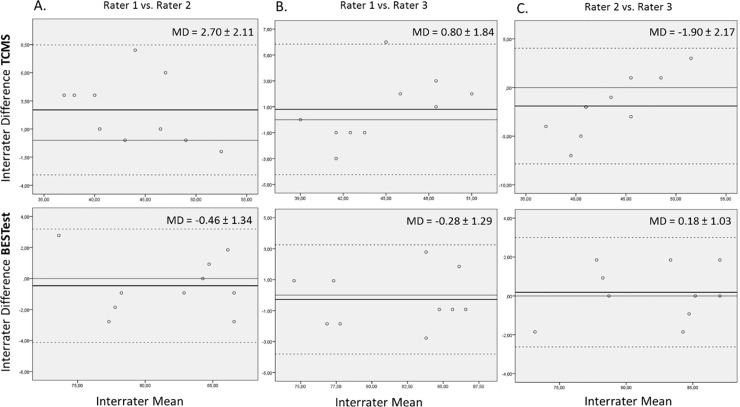
Fig 2. Bland-Altman plots for interrater reliability of TCMS and BESTest.
On the horizontal axis the interrater mean score on TCMS and BESTest is displayed. On the vertical axis the difference between the total scores of the raters is plotted. The solid thin line represents the zero axis. The bold black line represents the mean difference. The dotted lines indicate the limits of agreement. MD: Mean difference.

