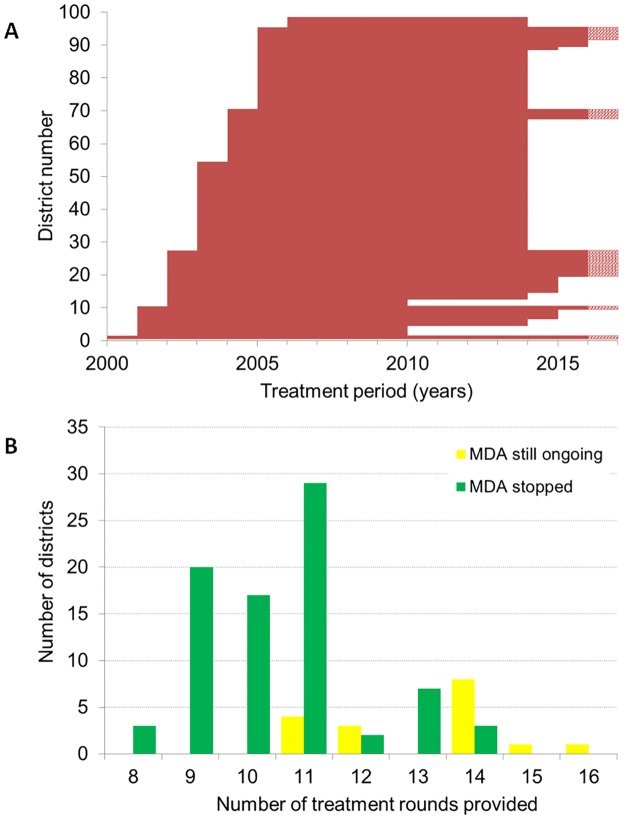
Fig 2. Duration of MDA by district in Ghana.
A) Period of MDA by each district in order of start year. Each horizontal line represents a district. Bars with a dashed section on the right-hand side represent districts where MDA is still ongoing after 2016 with unknown end year. See supplementary S2 Table for more details. B) Frequency distribution of the number of years of treatments provided by district through 2016, presented separately for districts that had stopped MDA by 2016 and those with still ongoing MDA.

