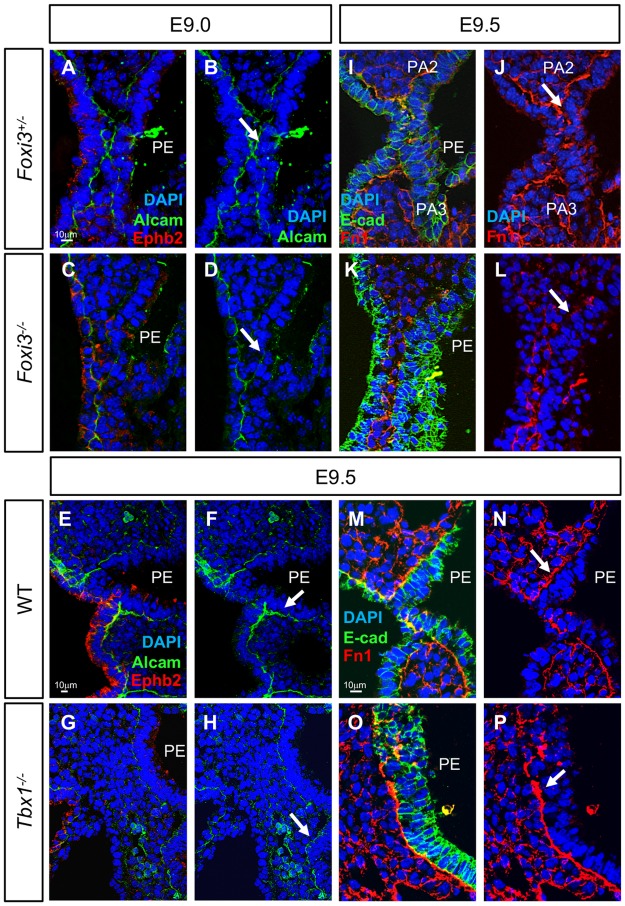
Fig 8. Alcam and Fibronectin expression is reduced in epithelial cells within the PA at E9.5 in Foxi3-/-, but not in Tbx1-/- embryos.
(A-H) DAPI (blue), Alcam (green) and Ephrin b2 (red) antibodies were used to examine coronal sections in embryos at E9.0. Alcam localizes to the basal side of epithelium and Ephrin b2 localizes to the apical side. Sections from Foxi3+/- control embryos are shown with all three fluorescence color channels (A) and only DAPI and Alcam (B). Sections from Foxi3-/- embryos are shown with all three channels (C) and only DAPI and Alcam (D). Sections from WT littermates of Tbx1-/- embryos are shown with all three channels (E) and only DAPI and Alcam (F). Tbx1-/- embryos are shown with all three channels (G) and only DAPI and Alcam (H). White arrows indicate where Alcam expression is reduced in Foxi3-/- mutant embryos, but is present in Tbx1-/- embryos in comparison to control embryos. (I-P); DAPI (blue), E-cadherin (E-cad, green) and Fibronectin (Fn1, red) antibodies mark epithelial cells and the intracellular matrix on coronal sections at E9.5. (I-J) Sections from Foxi3+/- control embryos shown with all three fluorescent channels (I) and only the red and blue channels (J). (K-L) Sections from Foxi3-/- embryos showing all three channels (K) and only the red and blue channels (L). White arrows indicate where expression is spotty and inconsistent in Foxi3-/- mutants. (M-P) Sections from WT (M-N) and Tbx1-/- embryos (O-P) showing all three channels (M and O) and only the red and blue channels (N and P). White arrow in N and P indicates where Fibronectin expression is increased in Tbx1-/- mutants. n = 3 for each genotype in each experiment.

