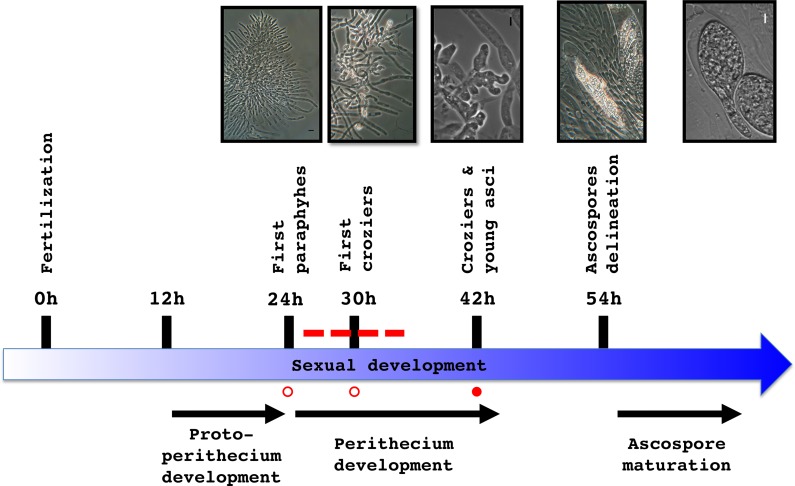
Fig 6. Transcriptomic analysis experimental design.
Schematic developmental time course from fertilization to ascospore maturation of wild-type crosses. Total RNA was extracted from wild-type perithecia at T24 and T30 (open circles) and from ΔPaRid micro-perithecia at T42 (solid circle); Dotted line: time frame during which the ΔPaRid developmental blockage might occur. Light microphotographs of the upper panel illustrate the various developmental steps indicated along the time course.

