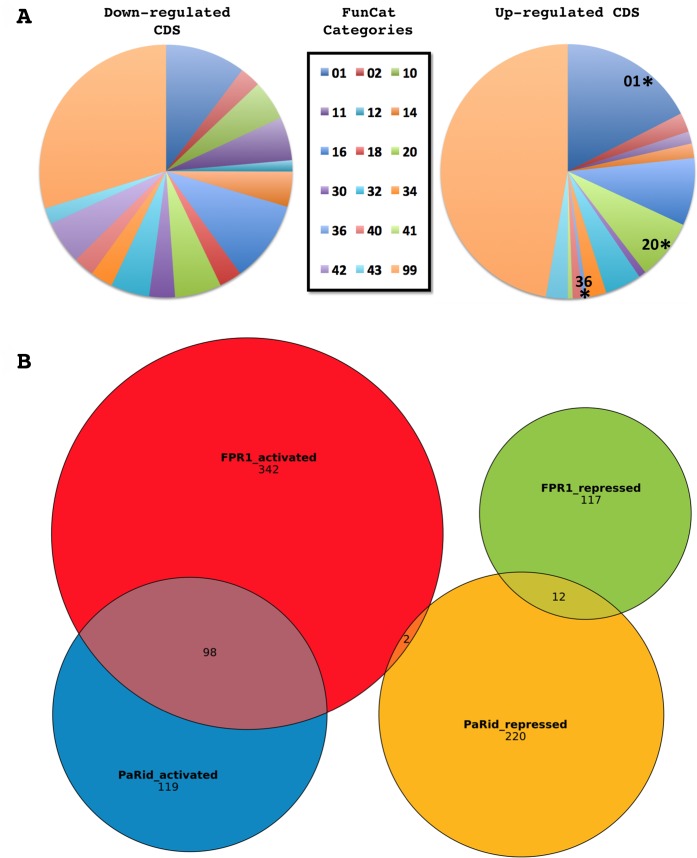
Fig 7. Transcriptomic analysis of differentially expressed CDS in response to ΔPaRid developmental arrest.
(A) Functional categories in the down- and up-regulated CDS sets. Legend of pie charts corresponds to the FunCat categories, see Table 2 for details. Stars mark significantly enriched functional categories (p-value < 0.05). (B) Venn diagram of PaRid and FPR1 targets.

