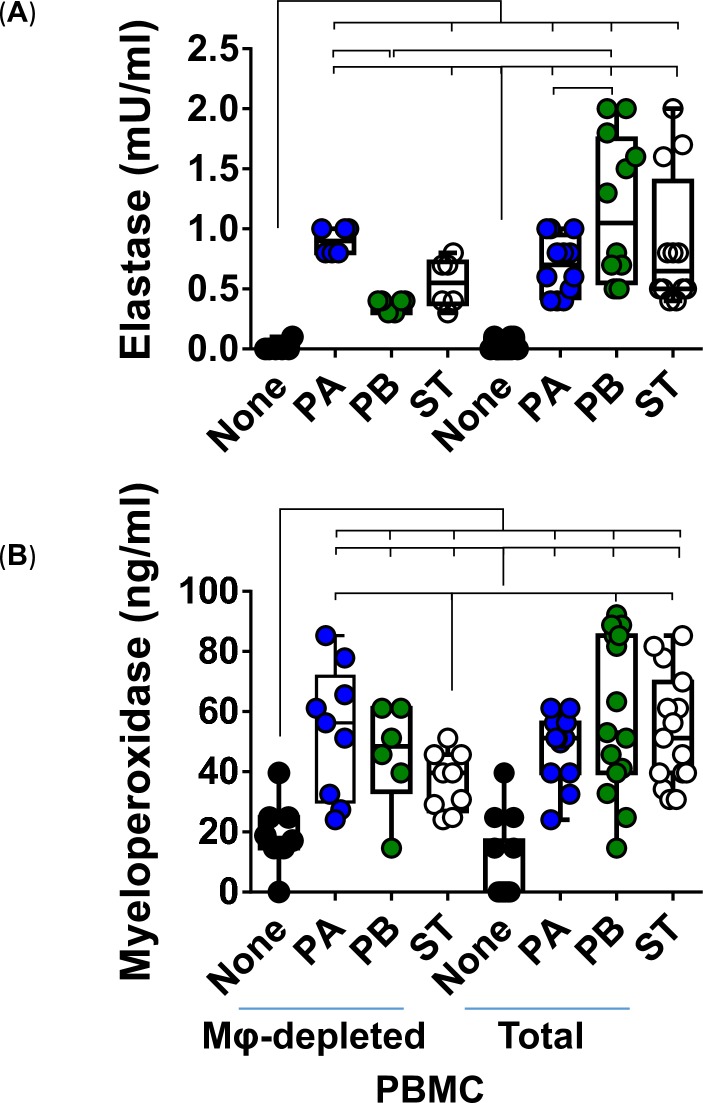
Fig 7. Production of antibacterial products by macrophages after stimulation with different Salmonella Typhi strains.
3-D organoids built with whole (Total) or macrophage-depleted (Mφ-depleted) PBMC were exposed, or not, to either Salmonella enterica serovar Paratyphi A (PA), Paratyphi B (PB), or Typhi (ST) strains. After 4 hours, supernatants were collected and used to measure (A) elastase and (B) myeloperoxidase by ELISA. Bar graphs extend from the 25th to 75th percentiles; the line in the middle represents the median of the pooled data. The whiskers delineate the smallest to the largest value. The data represent up to 5 individual experiments for each of Salmonella strains with 3 replicates each. Horizontal lines represent significant differences (P<0.05) between the indicated culture conditions. Complete list of P values is shown in S5 Table.

