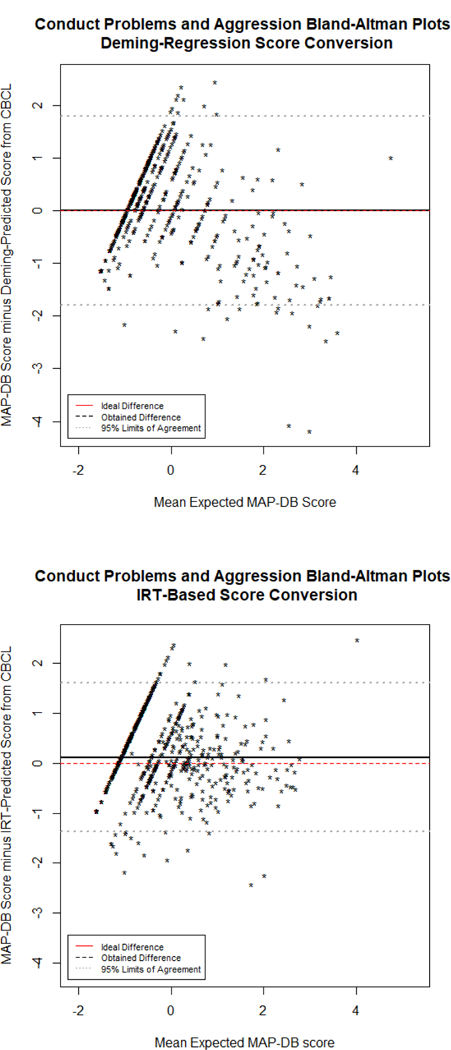
Figure 2: Conduct Problems and Aggression Bland-Altman Plots.

Bland-Altman plot representing the agreement between scores linked from the CBCL and obtained on the MAP-DB Early School Age Form. The mean of the linked and actual Aggression score is on the x-axis, whereas the difference (actual minus linked) is on the y-axis. A pronounced floor effect from the CBCL is apparent, regardless of method used for linking.
