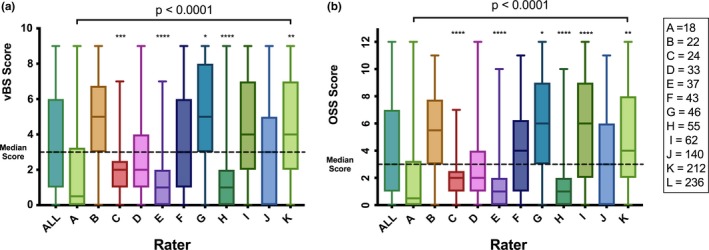
Figure 3.

Interrater reproducibility of the ocular surface staining scores. The median, minimum, and maximum scores of all the evaluations performed by 11 raters (A‐K) are shown. Each rater evaluated a different set and number of subjects, as shown in A. The difference of the medians was analyzed using the Brown‐Forsythe and Welch analysis of variance tests, correcting for multiple comparisons using Games‐Howell statistical hypothesis testing. The overall P value presented for raters A through K reflects the difference across all medians; the asterisks above each bar reflect the comparison of the individual rater versus the median of the scores of all raters. A, The median van Bijsterveld scores (vBS) by rater. B, The median Ocular Staining Scores (OSS) by rater.
