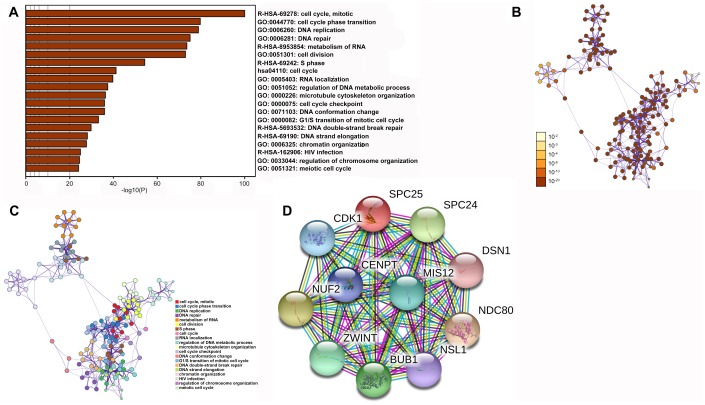
Figure 6.
Functional enrichments and protein interactions of SPC25. (A) Results of KEGG analysis of genes co-expressed with SPC25. (B) The network of enriched terms colored by p-value; terms containing more genes tend to have smaller p-values. (C) The network of enriched terms colored by cluster ID; nodes that share the same cluster ID are typically close to each other. (D) Interactions between SPC25 and other proteins.

