Figure 2.
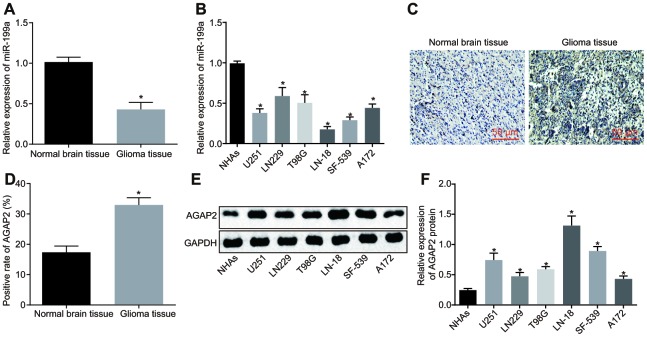
MiR-199a is poorly expressed, while AGAP2 highly expressed in glioma tissues and cell lines. (A) the expression of miR-199a in normal brain tissues and glioma tissues, determined by RT-qPCR. (B) the expression of miR-199a in NHAs and the glioma cell lines, determined by RT-qPCR. (C–D) the expression of AGAP2 in normal brain tissues and glioma tissues, detected by immunohistochemistry (200 ×). (E–F) the protein expression of AGAP2 in NHAs and different glioma cell lines, detected by Western blot analysis. * p < 0.05 compared with normal brain tissues or NHAs. The results were measurement data, presented as mean ± standard deviation. Independent sample t-test was used for the analysis in A and (D) One-way analysis of variance was used for other analyses. In tissues experiment, there were 75 glioma tissues and 17 normal brain tissues. The cell experiment was repeated three times.

