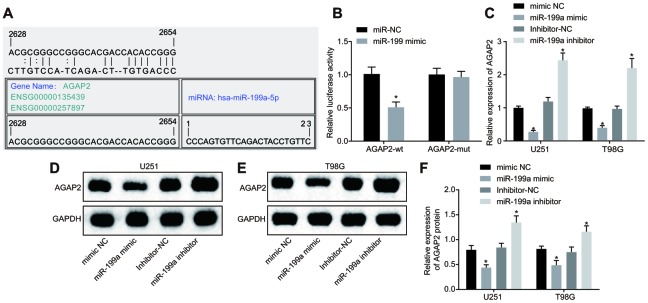
Figure 4.
MiR-199a directly targets AGAP2 and down-regulates its expression. (A) the target binding site between miR-199a and AGAP2 was predicted through the bioinformatics website. (B) the results of the dual luciferase reporter gene assay. (C) the mRNA expression of AGAP2 in U251 and T98G cell lines with over-expressed or inhibited miR-199a, determined by RT-qPCR. (D–E) the protein expression of AGAP2 in U251 and T98G cell lines with over-expressed miR-199a, detected by Western blot analysis. (F) the protein expression of AGAP2 in U251 and T98G cell lines in the presence of the inhibition of miR-199a, detected by Western blot analysis. * p < 0.05 compared with the corresponding NC. The results were measurement data, presented as mean ± standard deviation. Paired t-test was used for comparison between two groups. The experiment was repeated three times. mimic-NC, cells transfected with mimic-negative control; miR-199a mimic, cells transfected with miR-199a mimic; inhibitor-NC, cells transfected with inhibitor-negative control; miR-199a inhibitor, cells transfected with miR-199a inhibitor.

