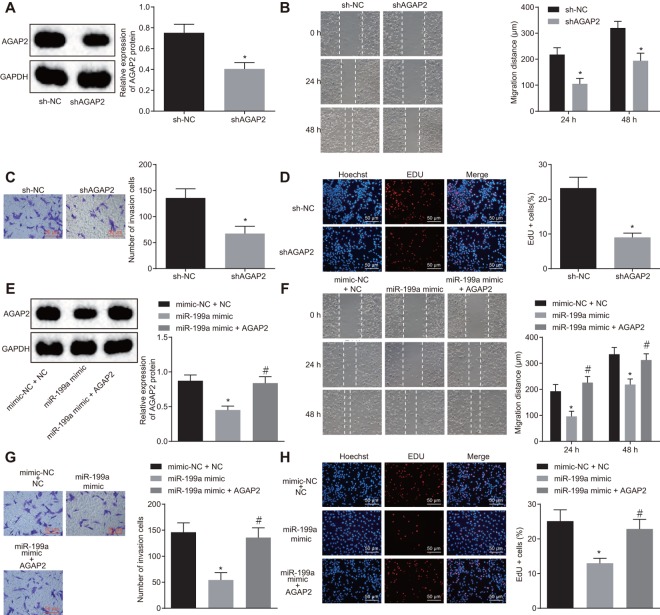
Figure 5.
The inhibitory role of miR-199a in U251 cells is mediated by the down-regulation of AGAP2. (A) the protein expression of AGAP2 after AGAP2 silencing, detected by Western blot analysis. (B) the migration ability of U251 cells after AGAP2 silencing, measured by scratch test (Scale bar = 100 μM). (C) the invasion ability of U251 cells after AGAP2 silencing, assessed by Transwell assay (Scale bar = 50 μM). (D) the proliferation ability of U251 cells after AGAP2 silencing, evaluated by EdU assay (Scale bar = 50 μM); (E) the protein expression of AGAP2 in the presence of miR-199a mimic or sh-AGAP2 or sh-NC, detected by Western blot analysis. (F) the migration ability of U251 cells (Scale bar = 100 μM), measured by scratch test. (G) the invasion ability of U251 cells (Scale bar = 50 μM), assessed by scratch test. (H) the proliferation ability of U251 cells, evaluated by EdU assay. (A–D) * p < 0.05 compared with the sh-NC group; (E–H) * p < 0.05 compared with mimic-NC + sh-NC group. # p < 0.05 compared with the miR-119a mimic group. The results were measurement data, presented as mean ± standard deviation. Paired t-test was used for the analysis in A, C and D. One-way analysis of variance was used for other analyses. The experiment was repeated three times. sh-NC, cells transfected with sh-negative control; sh-AGAP2, cells transfected with sh-AGAP2; mimic-NC + sh-NC, cells transfected with mimic-negative control and sh-negative control; miR-199a mimic, cells transfected with miR-199a mimic; miR-199a mimic + sh-AGAP2, cells transfected with miR-199a mimic and sh-AGAP2.

