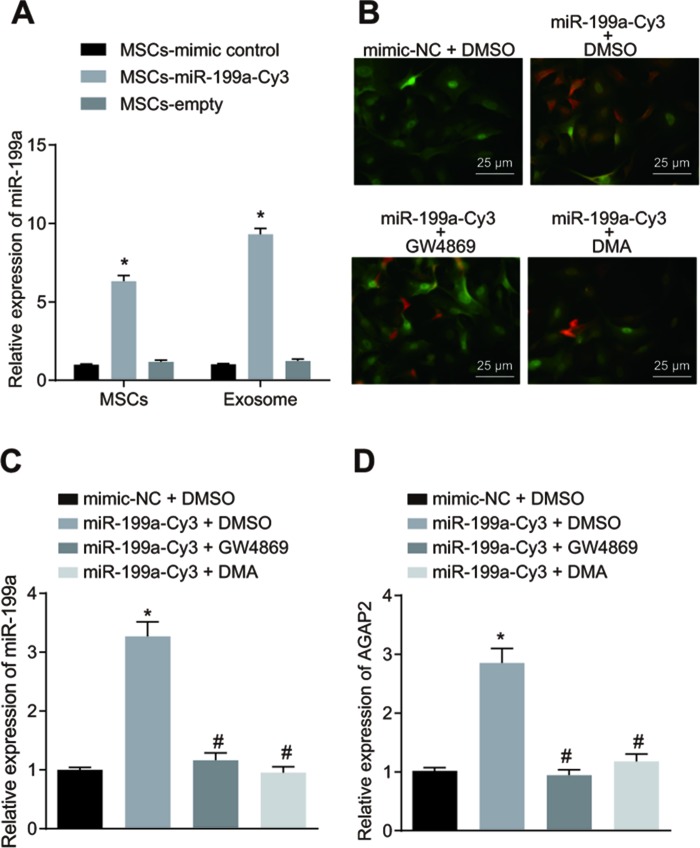
Figure 7.
The hMSCs deliver miR-199a to glioma cells by secreting exosomes. (A) the expression of miR-199a in the presence of MSC-miR-199a, MSC-miR-control and MSC-empty, determined by RT-qPCR. (B) miR-199a could be delivered to U251 glioma cells form hMSCs, verified by fluorescence microscopy detection (scar bar = 25 μM). (C) the expression of miR-199a in U251 cells after co-culture, determined by RT-qPCR. (D) the expression of AGAP in U251 cells after co-culture, determined by RT-qPCR. * p < 0.05 compared with the MSCs + mimic control group or the mimic-NC + DMSO group; # p < 0.05 compared with the miR-199a-Cy3 + DMSO group. The results were measurement data, presented as mean ± standard deviation. One-way analysis of variance was used for comparison among multiple groups. The experiment was repeated three times. RT-qPCR, reverse transcription quantitative polymerase chain reaction; MSCs, mesenchymal stem cells. mimic-NC + DMSO, cells treated with mimic-negative control and dimethyl sulphoxide; miR-199a-Cy3 + DMSO, cells treated with miR-199a-Cy3 and dimethyl sulphoxide; miR-199a-Cy3 + GW4869, cells treated with miR-199a-Cy3 and GW4869; miR-199a-Cy3 + DMA, cells treated with miR-199a-Cy3 and DMA.

