
Figure 2.
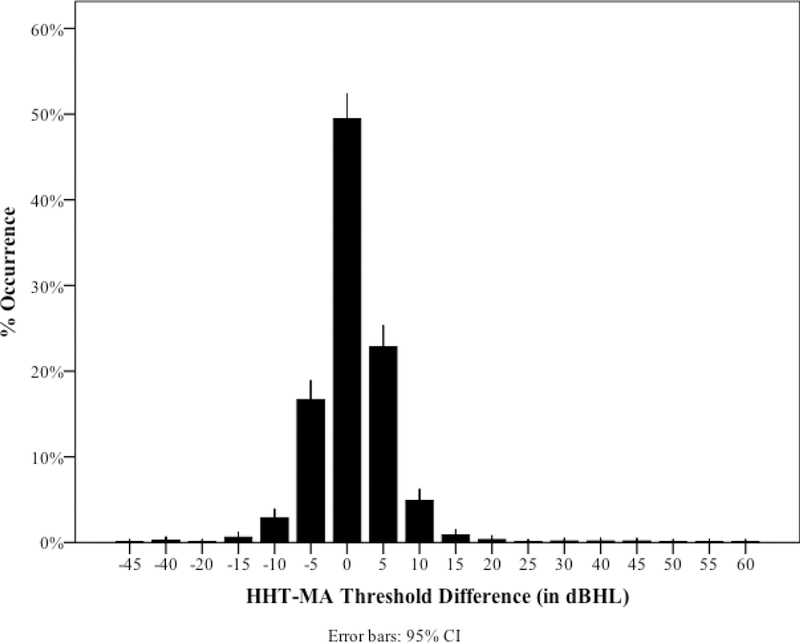
Distribution of differences between air-conduction thresholds measured using the HHT and manual audiometry for 224 ears of 112 participants tested at five frequencies.
Official websites use .gov
A
.gov website belongs to an official
government organization in the United States.
Secure .gov websites use HTTPS
A lock (
) or https:// means you've safely
connected to the .gov website. Share sensitive
information only on official, secure websites.
Distribution of differences between air-conduction thresholds measured using the HHT and manual audiometry for 224 ears of 112 participants tested at five frequencies.