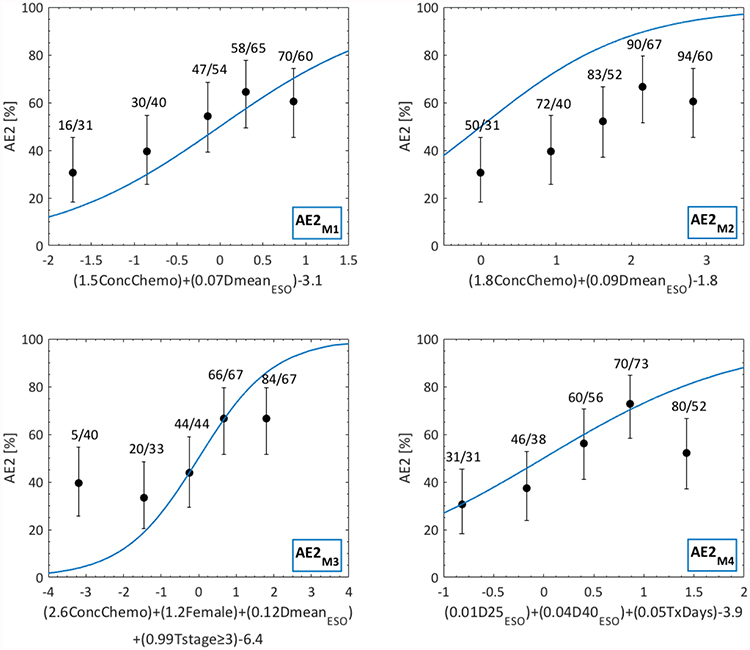
Fig 1.
Dose-response curves for the four published AE2 models (AE2M1-M4) as applied to the independent cohort. Note: AE2 predictions are given by blue lines; observed AE2 is denoted by black quintiles (error bars: 95% binomial confidence intervals); quintile-specific predicted/observed AE2 rates [%] are given above each quintile; the argument of each model’s logistic-regression based equation is given on the x-axis

