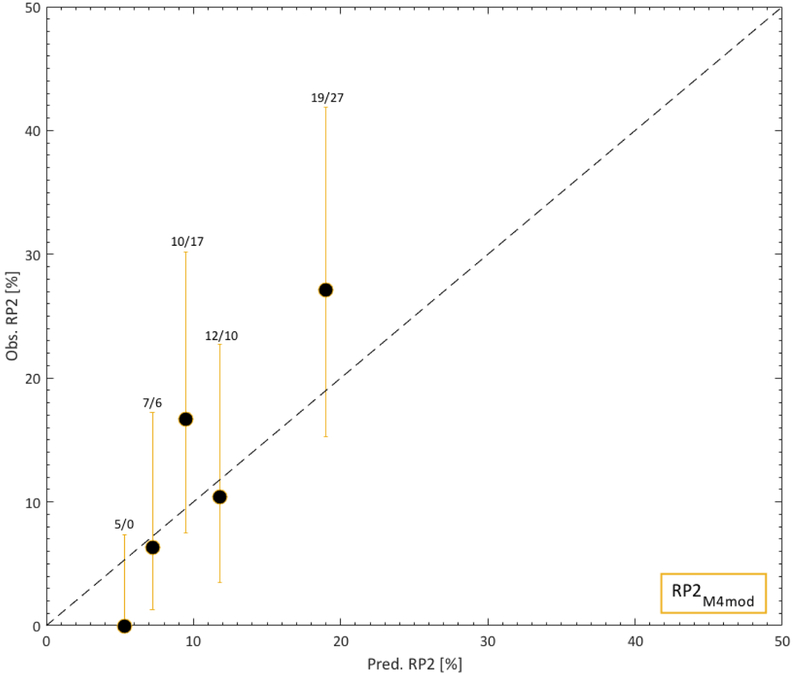
Fig 3.
Calibration curve for the modified RP2M4, i.e., RP2 M4mod based on the prevalence and ORs only for age and pulmonary comorbidity in the independent cohort. Note: RP2 predictions are given by orange lines; observed RP2 is denoted by black quintiles (error bars: 95% binomial confidence intervals); quintile-specific predicted/observed RP2 rates are given above each quintile; the black dotted line is an identity line.

