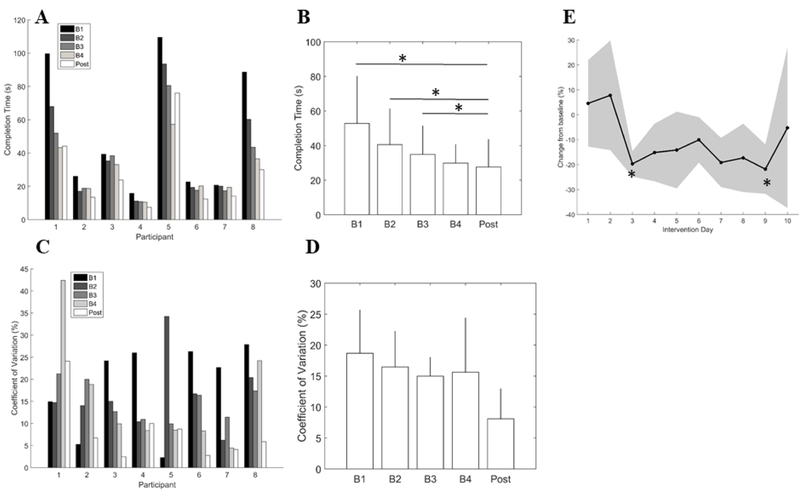
Figure 2.
(A) Individual task performance, (B) average group change in task performance, (C) Individual task variability (coefficient of variation, %), (D) average group change in task variability, (E) Daily performance during intervention displayed as % change from baseline. Error bars in (B) and (D) are 95% confidence intervals. Shaded region in (E) is 95% confidence region. *p<0.0125. B1-B4: Repeated baseline assessments 1–4, Post: post-testing; s: seconds.

