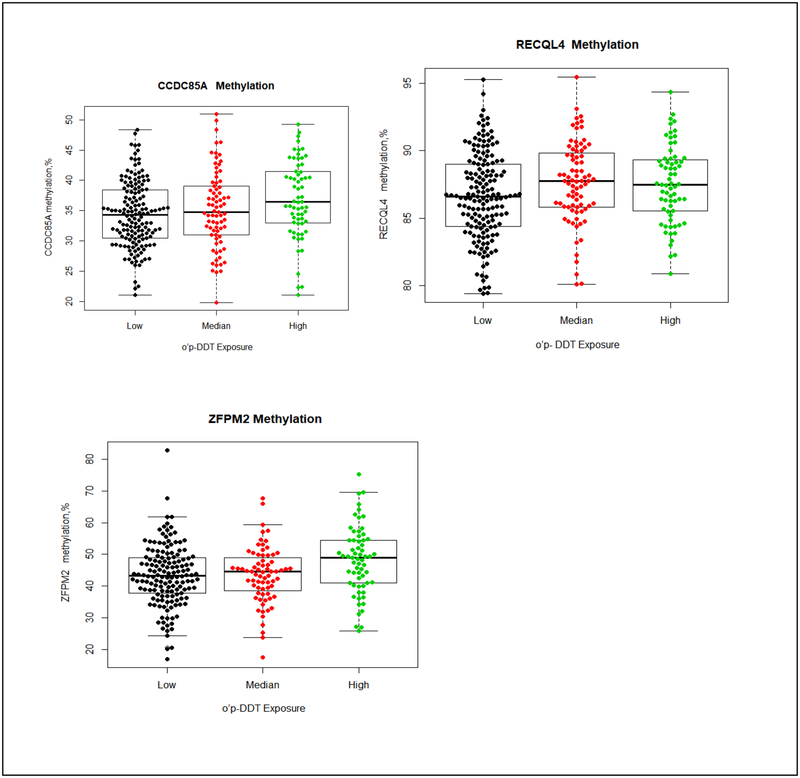
Figure 3. Methylation differences by o,p’-DDT in CCDC85A, RECQL4 and ZFPM2.
The boxplot displays the distribution of CpG methylation values (percent) by different o,p’-DDT exposure group (low exposure, ≤ 0.42 μg/L; median exposure, 0.43–0.72 μg/L; high exposure, > 0.72 μg/L) in 3 gene regions (CCDC85A, RECQL4 and ZFPM2) examined. The middle bold line represents the median methylation. Each dot represents the methylation value of each samples. The distribution of percentage of CCDC85A methylation (top left) by each o,p’-DDT exposure group: low exposure (median: 34.3%, Q1-Q3=(30.5%, 38.5%), Min-Max(21.0%, 48.3%)); median exposure (median:34.8%, Q1-Q3=(31.0%, 39.1%), Min-Max=(19.8%, 50.9%)); high exposure (median: 36.4%, Q1-Q3=(33.0%, 41.5%), Min-Max=(21.0%, 49.3%)). The distribution of percentage of RECQL4 methylation (top right) by each o,p’-DDT exposure group: low exposure (median: 86.7%, Q1-Q3=(84.4%, 89.0%), Min-Max= (79.4%, 95.3%); median exposure (median: 87.8%, Q1-Q3=(85.8%, 89.8%), Min-Max=(80.1%, 95.4%)); high exposure (median:87.5%, Q1-Q3=(85.5%, 89.4%), Min-Max=(80.9%, 94.3%)). The distribution of percentage of ZFPM2 methylation (down left) by each o,p’-DDT exposure group: low exposure (median: 43.3%, Q1-Q3=(37.8%, 49.0%), Min-Max(16.9%, 82.9%)); median exposure (median:44.6%, Q1-Q3=(37.8%, 49.7%), Min-Max=(17.4%, 67.8%)); high exposure (median: 48.9%, Q1-Q3=(41.0%, 54.5%), Min-Max=(25.7%, 75.3%)).

