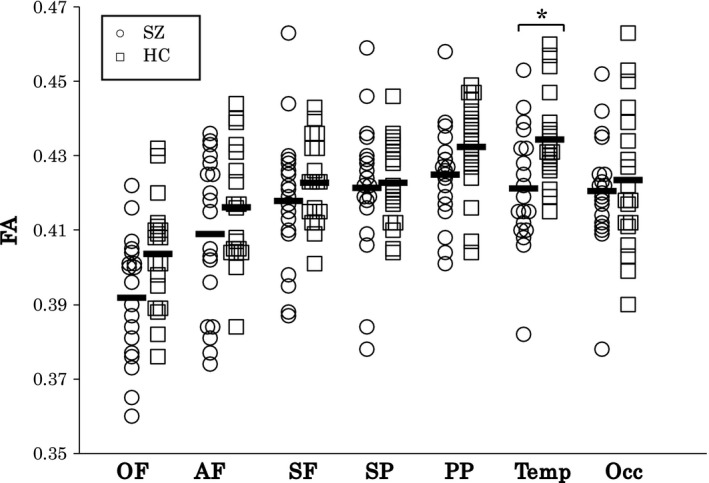
Figure 4.

Scattergram for the FA of callosal fibers in the OF, AF, SF, SP, PP, Temp, and Occ segments in HC and SZ groups. The black bars represent means of each segment. Data marked * are significant at p < 0.025. AF, anterior frontal; FA, fractional anisotropy; HC, healthy controls; Occ, occipital; OF, orbital frontal; PP, posterior parietal; SF, superior frontal; SP, superior parietal; SZ, schizophrenia; Temp, temporal
