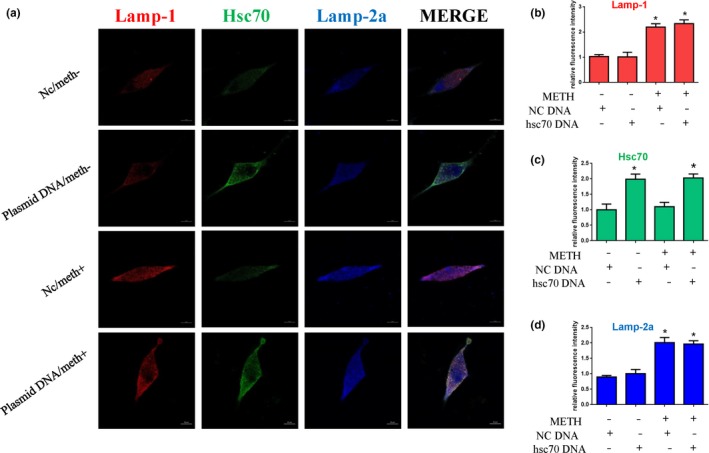
Figure 7.

CMA activity was assessed by triple immunofluorescence labeling of Lamp‐1 (red), Lamp‐2a (blue), and Hsc70 (green) (a), and the expression levels of Hsc70 and Lamp‐2a and Lamp‐1 were determined by the standard quantitative analysis of fluorescence intensity (b–d). The fluorescence intensity level is presented as the mean ± SD (n = 3/group). *p < 0.05 compared with the control group. **p < 0.05 compared with the Hsc70 overexpression plasmid‐ and METH‐treated group
