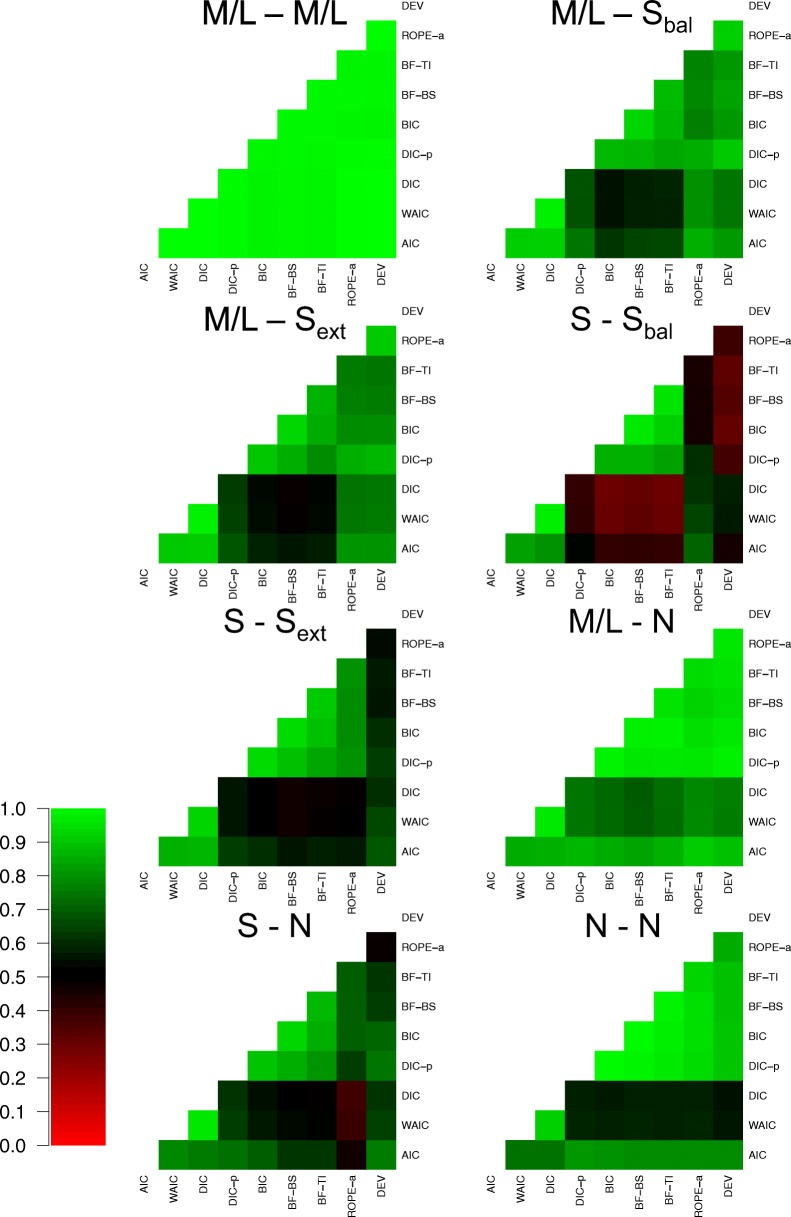
Fig. 7.
Plots the agreement in selected model between each of the eight model selection methods (rows and columns of each plot) for eight different groupings of the data (different plots). Lighter shades of green indicate greater agreement, lighter shades of red indicate greater disagreement, and black indicates intermediate agreement, which can be seen in the color bar to the left-hand side. For the groupings of the data, ‘n refers to no effect, ‘S’ refers to a small effect, and ‘M/L’ refers to a moderate or large effect. The two different letters refer to whether the data were generated with both effects, one effect, or neither effect. When the data were generated with both effects, the subscript ‘bal’ refers to a balanced difference between conditions, and the subscript ‘ext’ refers to an extreme difference between conditions

