
Fig. 2.
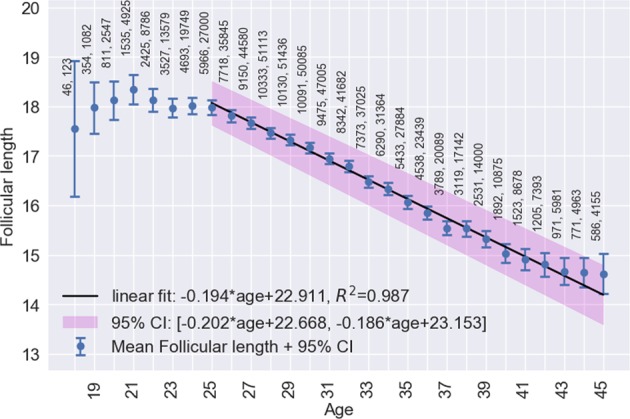
Age versus mean follicular phase length ±2 standard errors of the mean (blue). Linear regression (black) fitted in the range 25–45 with 95% CI (pink). Points are labelled with the number of users followed by the number of cycles
Official websites use .gov
A
.gov website belongs to an official
government organization in the United States.
Secure .gov websites use HTTPS
A lock (
) or https:// means you've safely
connected to the .gov website. Share sensitive
information only on official, secure websites.
Age versus mean follicular phase length ±2 standard errors of the mean (blue). Linear regression (black) fitted in the range 25–45 with 95% CI (pink). Points are labelled with the number of users followed by the number of cycles