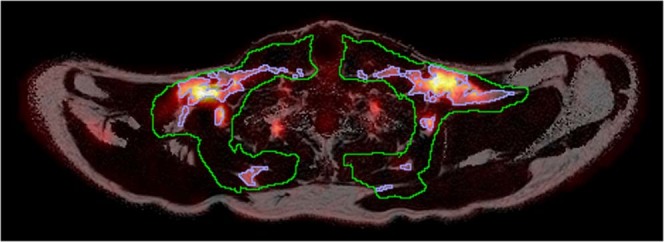
Figure 4.

Axial slice showing the supraclavicular BAT depot. MRI-derived FF map from the multi-echo scan using the grayscale colourmap with the PET-derived GUR superimposed using the heat colourmap. The green delineation is the initial rough delineation and the blue delineation the area remaining after thresholding and erosion that was used to calculate BAT FF15e and R2*. Note that data collected during the cooling is shown to illustrate the overlap between areas with a high GUR and the areas segmented to calculate BAT FF15e and R2*.
