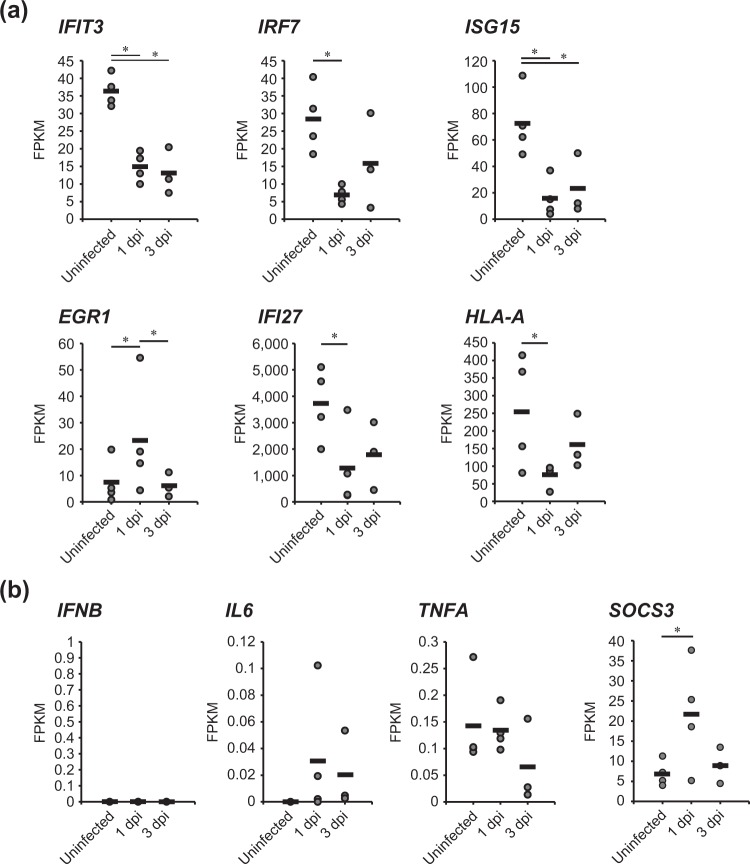
Figure 6.
Expression analysis of genes related to type I interferon signaling. (a) Expression levels (in uninfected tree shrew and in HBV-infected tree shrew at 1 and 3 dpi) of genes whose GO included the term “type I interferon signaling pathway” and exhibited the strongest differential expression genes at 1 dpi. (b) Expression levels (in uninfected tree shrew and in HBV-infected tree shrew at 1 and 3 dpi) of genes known to be central to the type I interferon signaling pathway. Horizontal bars indicate mean values in each group. Asterisks indicate significant differences (p < 0.05).

