Fig. 2.
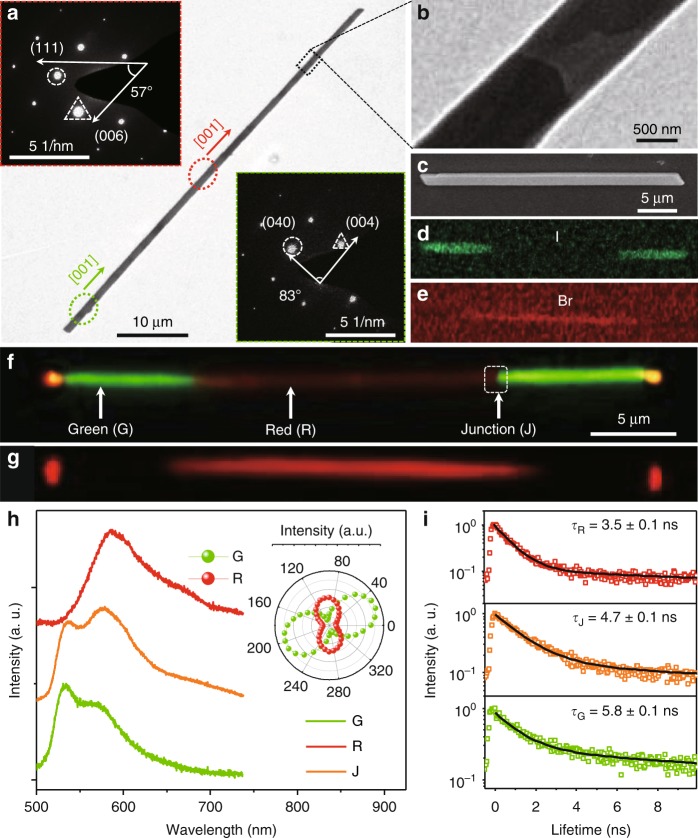
Structure and optical characteristics of TNWs. a The TEM image of one typical TNW, scale bar: 10 μm. The SAED patterns at the upper-left and the below-right insets correspond to the center part with red marked area and the end part green marked area in TNWs, respectively. b The magnified image of the junction in the TNW, scale bar: 500 nm. c The SEM image of one typical TNW; scale bar: 5 μm. The corresponding energy-dispersive X-ray spectroscopy (EDS) mapping for elements (d) iodine (I) and (e) bromide (Br), respectively. The FM images of one typical TNW excited with (f) the UV band and (g) the green band (500–550 nm), scale bar: 5 μm. h Spatially resolved PL spectra and i PL decay curves collected from different locations marked in (f). Inset of h: the corresponding polar image of the peak intensities

