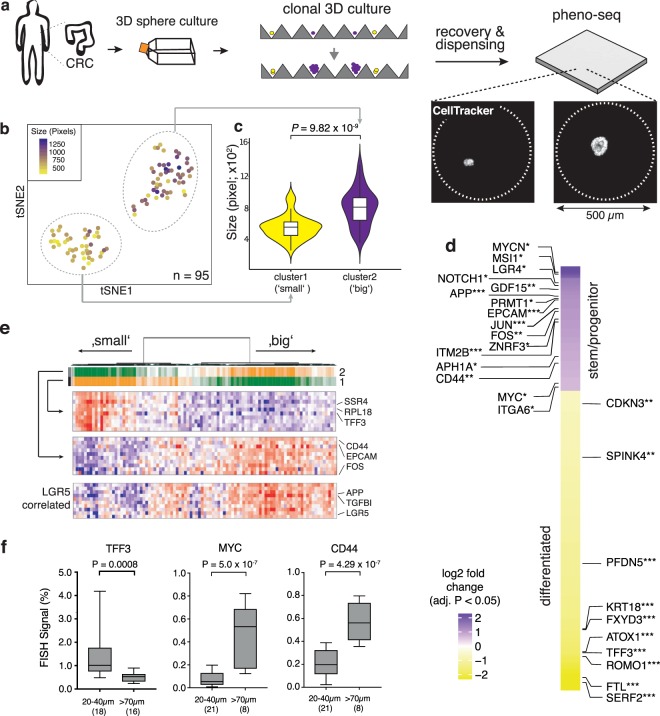
Figure 2.
Pheno-seq with a 3D model of colorectal cancer links heterogeneous proliferative phenotypes to expression signatures enriched for lineage-specific markers. (a) Clonal 3D-culture in inverse pyramidal shaped microwells and recovery strategy for HT-pheno-seq of patient-derived CRC spheroids isolated from a liver metastasis. Yellow and purple indicate heterogeneous subpopulations with functional differences in proliferative capacity4. (b) 2D tSNE visualization of 95 HT-pheno-seq expression profiles. Coloring by sphere size (pixel). (c) Spheroid size plotted per cluster. Violin-plot center-line: median; box limits: first and third quartile; whiskers: ±1.5 IQR). Indicated P-value calculated from unpaired two-tailed Students t-test. (d) Heatmap reflecting differential expression analysis37 of identified clusters in (b). Selected genes are listed beside the heatmap; Fold change >1.5; adjusted P-value < 0.05; *P < 0.05, **P < 0.01, ***P < 0.001; ‘small’ cluster1: 313 differentially expressed genes; ‘big’ cluster: 130 differentially expressed genes. (e) PAGODA RNA-seq analysis heatmap of CRC spheroid pheno-seq data. Dendrogram reflects overall clustering and the rows below represent top two significant aspects of heterogeneity based on HALLMARK/GO gene sets derived from the MSigDB38 and on de-novo identified gene sets. High PC Scores correspond to high expression of associated gene sets. Expression patterns below reflect top 10 loading genes for selected gene sets that are associated with respective aspects. Bottom: Expression pattern of genes most highly correlated with intestinal stem cell marker LGR5 (Pearson’s correlation). (f) Validation of pheno-seq by quantitative RNA-FISH for size-dependent differentiation marker TFF3 and cancer stem cell markers CD44/MYC. Plotted values reflect the pixel fraction that exceeds the background threshold per spheroid (Box plot center-line: median; box limits: first and third quartile; whiskers: min/max values; P-values from unpaired Students t-test. Numbers of samples n indicated on x-axis under respective class).

