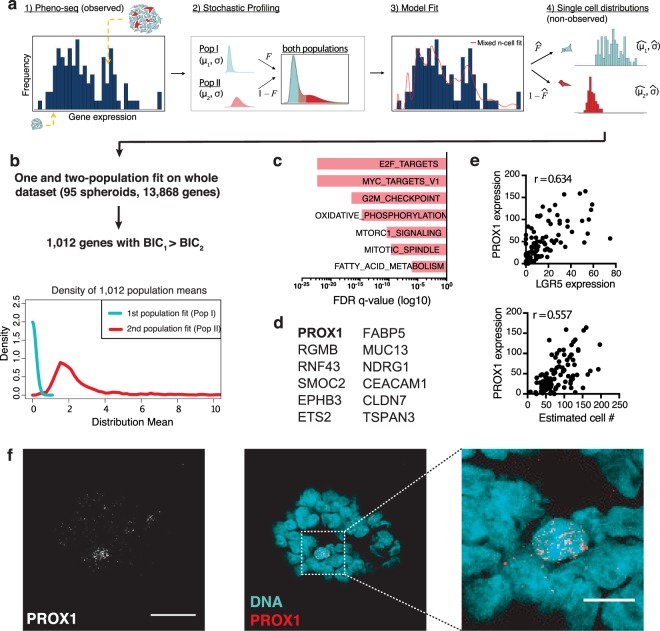
Figure 3.
Single-cell deconvolution of CRC spheroid pheno-seq data by maximum likelihood inference. (a) Concept of adapted maximum likelihood approach45 based on estimated cell numbers and transformed pheno-seq data (n = 95): (1) Acquired and transformed pheno-seq data based on estimated cell numbers build a distribution of measurements for inference by the model. Coloring of cells in spheroids: red = stem-like; cyan = differentiated. (2) Assumptions on single cell distributions: Model of heterogeneous gene regulation in which single cells are supposed to exhibit gene expression at low (Pop I) or high (Pop II) levels with a common coefficient of variation. The four parameters of the model are the log-mean expression for each subpopulation (𝜇1 and 𝜇2), the proportion of cells in the high subpopulation (𝐹), and the common log-SD of expression (σ). (3) Based on the model in step 2, a likelihood function is derived that takes different numbers of cells per spheroid into account. The likelihood function is then maximized by searching through the four parameters of the model to identify those that are most likely given the experimental observations. 4) These four parameters define the inferred single cell distributions of the low and high-level populations. (b) 1,012 genes show an improved two-population fit compared to a one population fit (BIC: Bayesian information criterion). Densities of the means of the first (Pop I: low regulatory state) and second population (Pop II: high regulatory state) for all identified 1,012 genes. (c) Gene set enrichment analysis for two-population genes based on Hallmark gene sets35 derived from the MSigDB38. Bar plot showing top enriched gene sets ranked by FDR q-values. (d) Selected human colonic stem and differentiation markers46 that have been identified by pheno-seq deconvolution. (e) Scatter plots for relations of PROX1 expression and estimated cell numbers (lower) and between PROX1 expression and expression of the major intestinal stem cell marker LGR5 (upper) as well as associated Pearson’s correlation coefficients (r). (f) RNA-FISH staining of CRC spheroids for PROX1 (Atto550) and DAPI counterstaining for visualization of DNA. Merged images: DNA: cyan; PROX1: red. Images represent Z-projections (scale bar 30 µm and 10 µm for magnified merged image).

