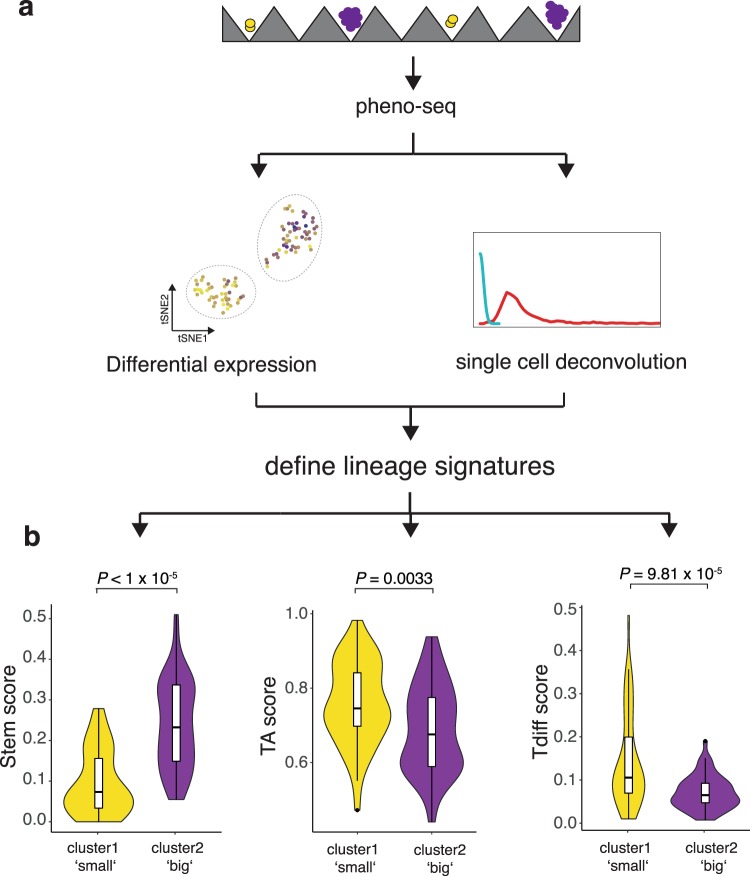
Figure 4.
Scoring of pheno-seq data for subtype-specific signatures links long-term proliferative capacity to a stem-like subtype in CRC. (a) Strategy to define lineage-specific expression signatures. Stem: PROX1 correlated genes (top 20); Transit-amplifying (TA): Ribosomal genes (n = 24); Terminally differentiated (Tdiff): TFF3 correlated genes (top 20). (b) Violin Plots showing (cluster-specific) pheno-seq expression profiles scored for subtype signatures (see Methods). Violin-plot center-line: median; box limits: first and third quartile; whiskers: ±1.5 IQR). Indicated P-value calculated from unpaired two-tailed Students t-test.

