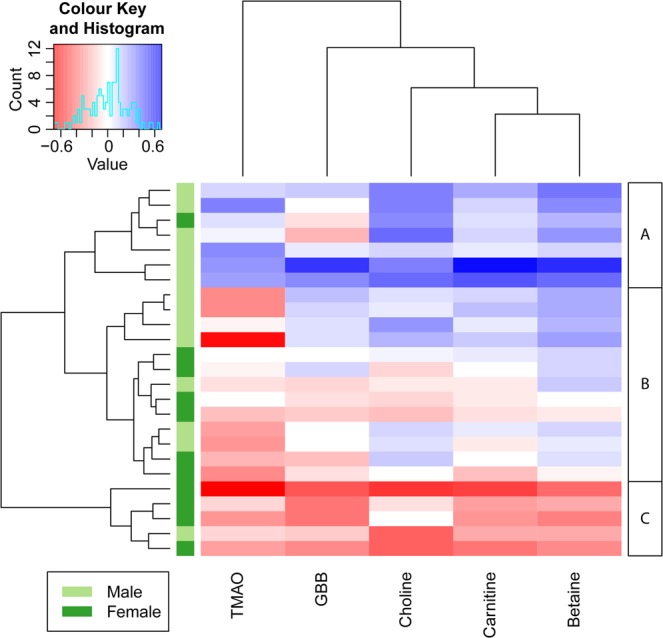
Figure 6.

Heat map of the log2 transformed serum level differences between the fasted and non-fasted time point. Blue and red cells represent increased and decreased SLM-challenged metabolite levels in serum, respectively. The volunteers and metabolites are sorted by hierarchical clustering. Dendograms are used to show distances between samples (rows) and metabolites (columns). Based on the hierarchical clustering, three groups could be identified indicating volunteers with increased levels (A), limited differences (B) and decreased levels (C). It can be clearly seen that A and C consist of mainly male and female volunteers, respectively.
