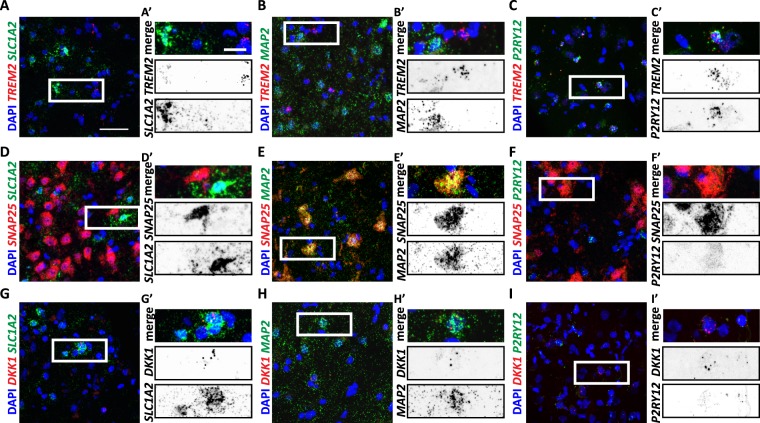
Figure 2.
Single-cell resolution of TREM2, SNAP25 and DKK1 mRNAs present differential cell-type expression. Confocal images of control hippocampal slices showing TREM2, SNAP25 and DKK1 co-localising with different cell-type-specific markers including SLC1A2 (astrocytic), MAP2 (neuronal) and P2RY12 (microglial). (A–C) RNAscope of TREM2 (red) showing no colocalization with SLC1A2 (A-A’; green) nor MAP2 (B-B’; green), but P2RY12 (C-C’; green). (D–F) In situ hybridisation of SNAP25 (red) showing no colocalization with SLC1A2 (D-D’; green) or P2RY12 (F-F’; green), but MAP2 (E-E’, green) (G–I) RNAscope of DKK1 (red) showing colocalization with SLC1A2 (G-G’; green) and MAP2 (H-H’, green) but not with P2RY12 (I-I’; green). DAPI indicates nuclear staining (blue) in all cases. Scale bars 50 µm, zoom imaged 20 µm.

