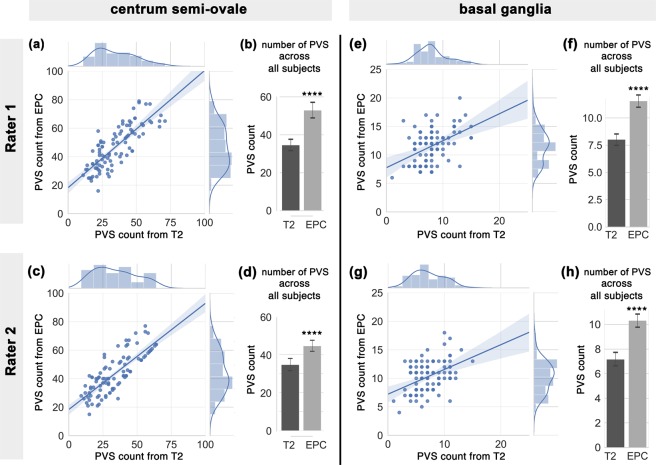
Figure 4.
PVS number (counted by experts readers) in centrum semi-ovale and basal ganglia across the analyzed subjects (N = 99), counted in T2-weighted (T2w) and enhanced PVS contrast (EPC) images. First row refers to the first expert reader, and second row relates to the second expert reader. (a,c) plots show the correlation between the number of PVS counted on T2w and EPC images, and their distribution. (b,d) bars compare the mean and standard deviation of PVS across all subjects as derived from T2w and EPC images. (e–h) plots are similar to (a–d) but related to basal ganglia scores. Note that expert readers counted significantly higher number of PVS when EPC was used (see results section for statistics).

