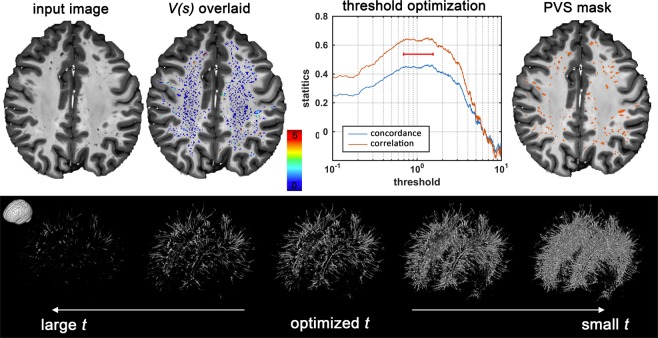
Figure 5.
Automated quantification of PVS likeliness and PVS segmentation. First row shows an enhanced PVS contrast (EPC) image and the vesselness map, V(s), obtained from Frangi filtering (see method section and Eq. (2) for details). The optimization results to find an optimum global threshold for EPC is shown, in which t = 1.5 resulted to the highest concordance and correlation between automated PVS counting across the whole white matter and expert counting (number of PVS in the axial slice with the highest PVS presence). Second row highlights the influence of threshold selection on the PVS mask. A too small or too high threshold results in a large number of false positives or false negatives, respectively.

