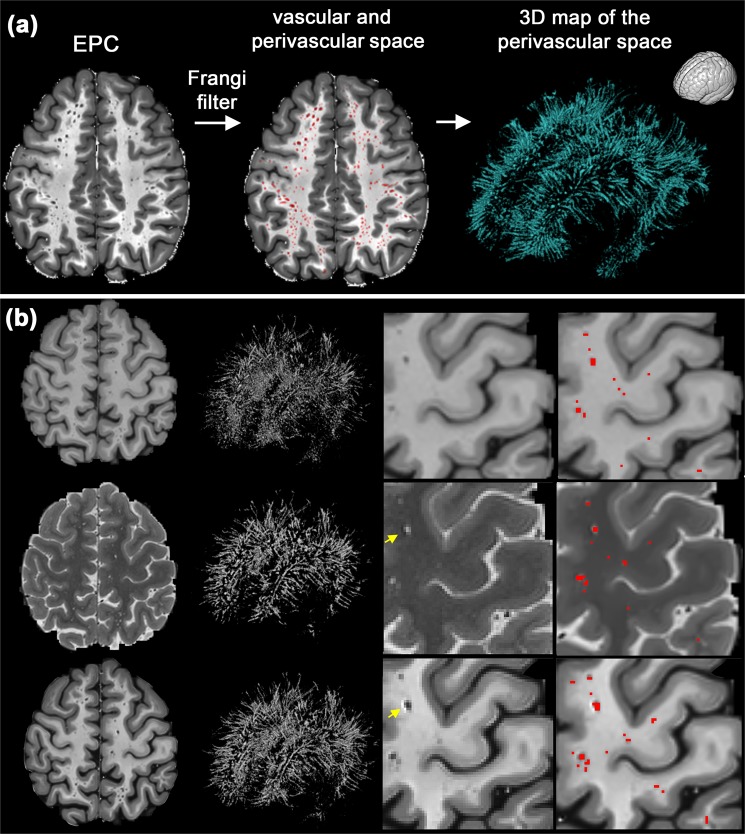
Figure 7.
Mapping perivascular space (PVS). (a) an example of PVS segmentation using the Frangi filter with the optimum threshold. (b) Comparison of automated segmentation when T1w, T2w, and EPC were used as the input. Supplementary Video 1 shows a 3D view of the PVS mask obtained from EPC. Yellow arrows show voxels with an artifact (which could be Gibbs ringing and/or internal gradient artifact). Given the inverse signature of this artifact in relation to PVS in both T2w and EPC, the PVS identification was unaffected.

