Fig. 1.

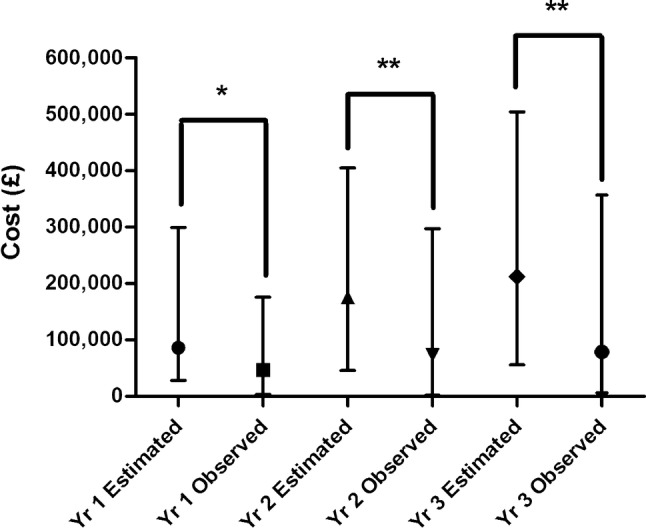
Median (with interquartile range) of estimated and observed expenditure in each year post-recommendation (n = 49). *p < 0.05, **p < 0.01 (Wilcoxon matched-pairs signed rank test). Yr year

Median (with interquartile range) of estimated and observed expenditure in each year post-recommendation (n = 49). *p < 0.05, **p < 0.01 (Wilcoxon matched-pairs signed rank test). Yr year