
Fig. 2.
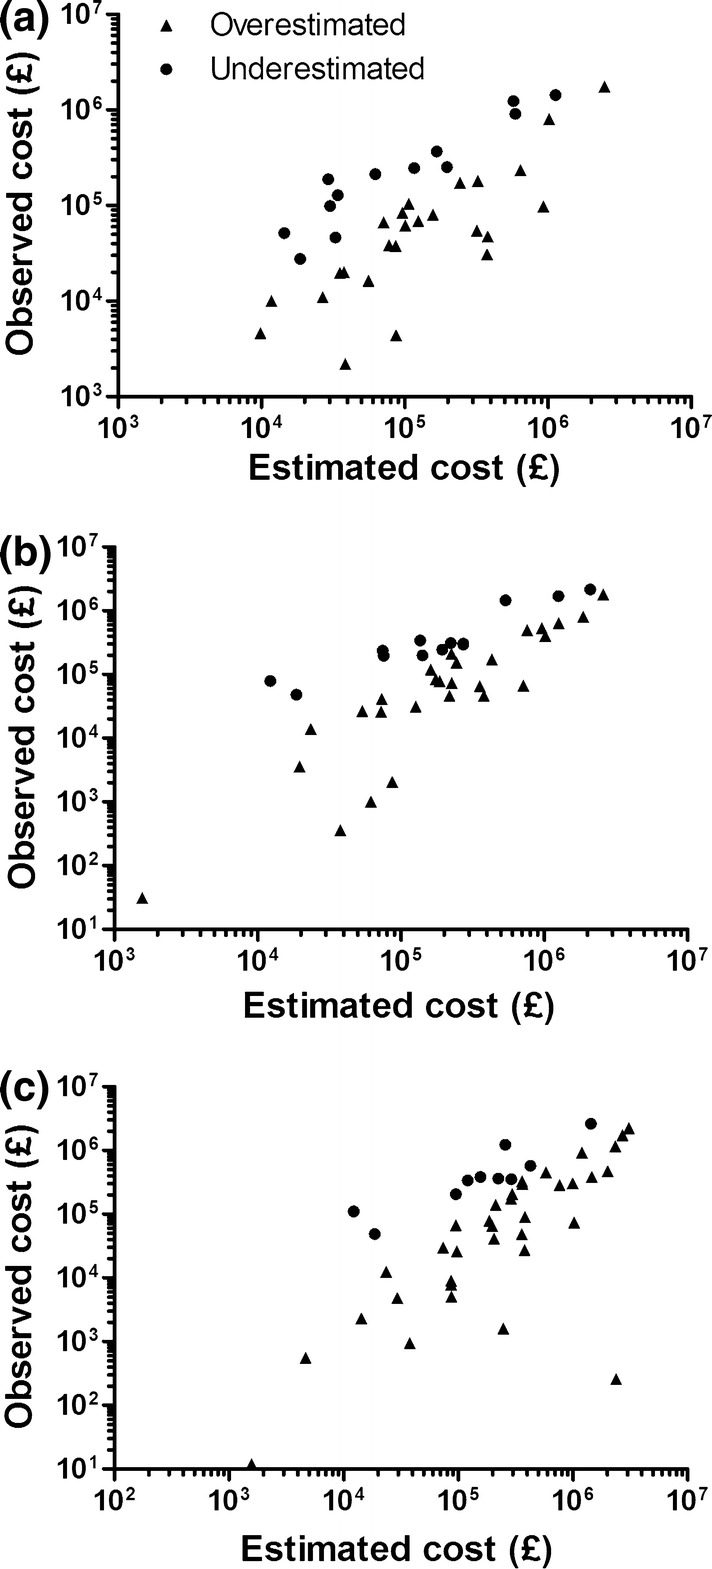
Estimated versus observed expenditure for years 1 (a), 2 (b) and 3 (c) post-recommendation. The 11 medicines for which there was a zero observed cost in year 1, the nine medicines for which there was a zero observed cost in year 2, and the four medicines for which there was a zero observed cost in year 3 are not represented on the graphs (a–c, respectively), but were included in the statistical analysis