Fig. 4.

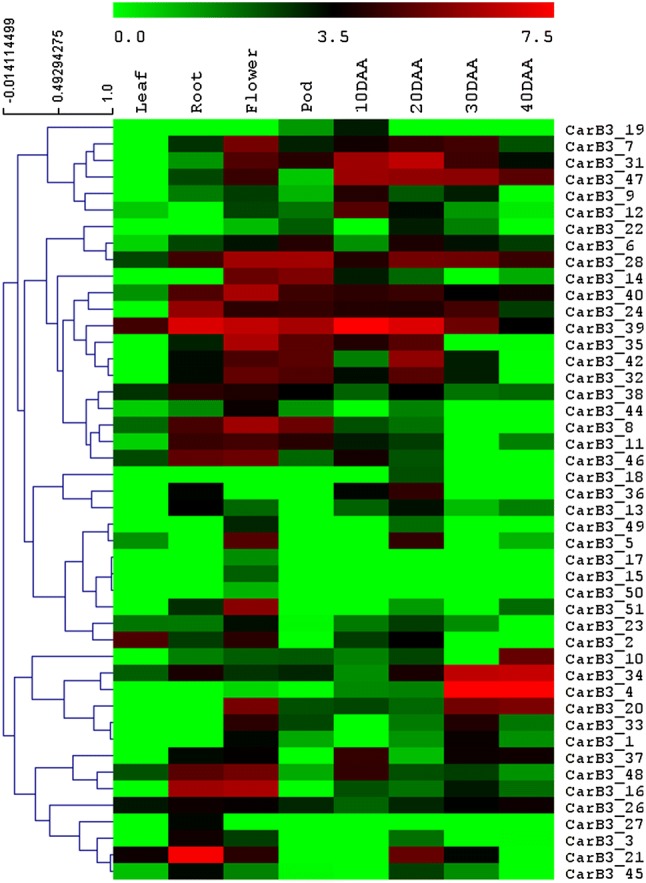
Hierarchical clustering of CarB3 genes based on digital expression analysis in different chickpea tissues. Scale bar represents the log2 normalized RPKM values. Color gradient denotes level of expression; red being high and green being low

Hierarchical clustering of CarB3 genes based on digital expression analysis in different chickpea tissues. Scale bar represents the log2 normalized RPKM values. Color gradient denotes level of expression; red being high and green being low