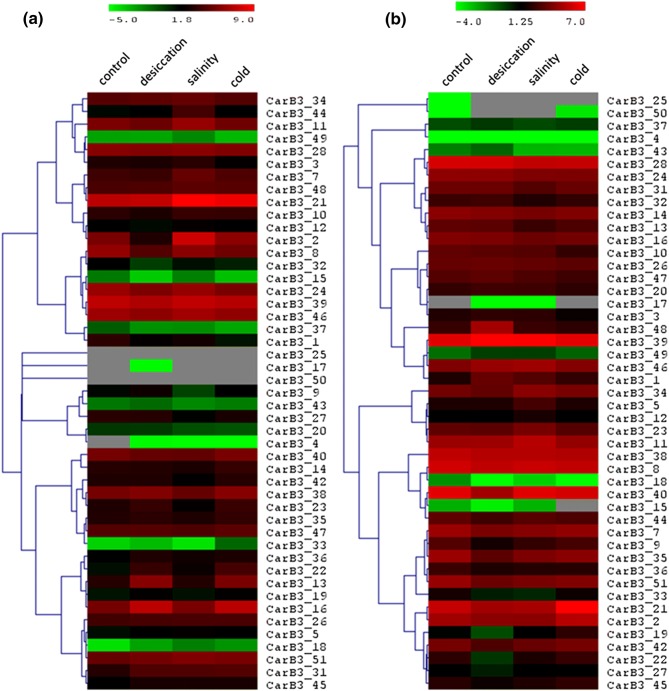
Fig. 6.
Heat map showing the digital expression of CarB3 genes in different stress conditions: desiccation, salinity, cold. a Control and stressed root tissues. b Control and stressed shoot tissues. Clustering method: hierarchical clustering. Color gradient denotes level of expression; red being high and green being low. Grey color depicts no expression

