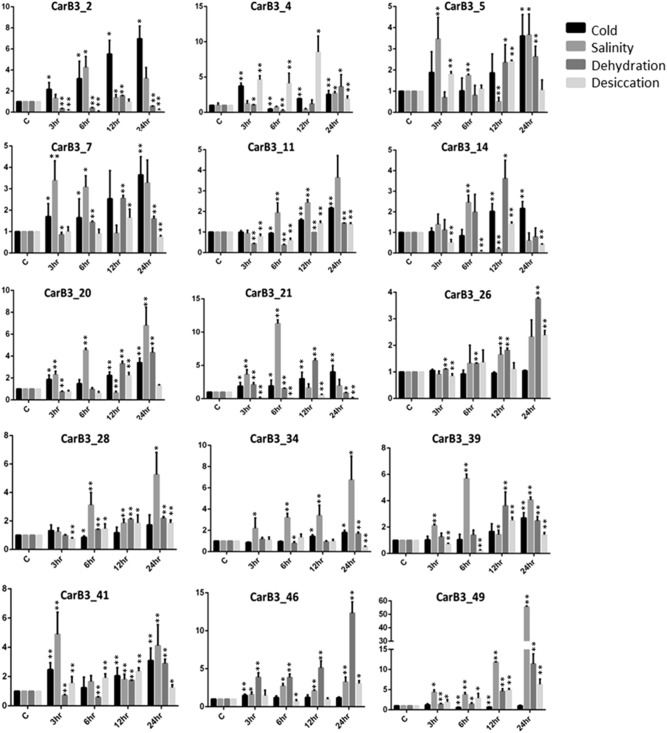
Fig. 7.
Expression analysis of 15 selected CarB3 genes in response to different stress conditions: cold, salinity, dehydration, desiccation at different time points through qRT-PCR. Values on Y-axis denote relative expression values. Error bars indicate standard deviation (± SD) of three biological replicates each calculated from three technical replicates. Asterisks indicate statically significant difference from the control (t test, *P < 0.05, **P < 0.01)

