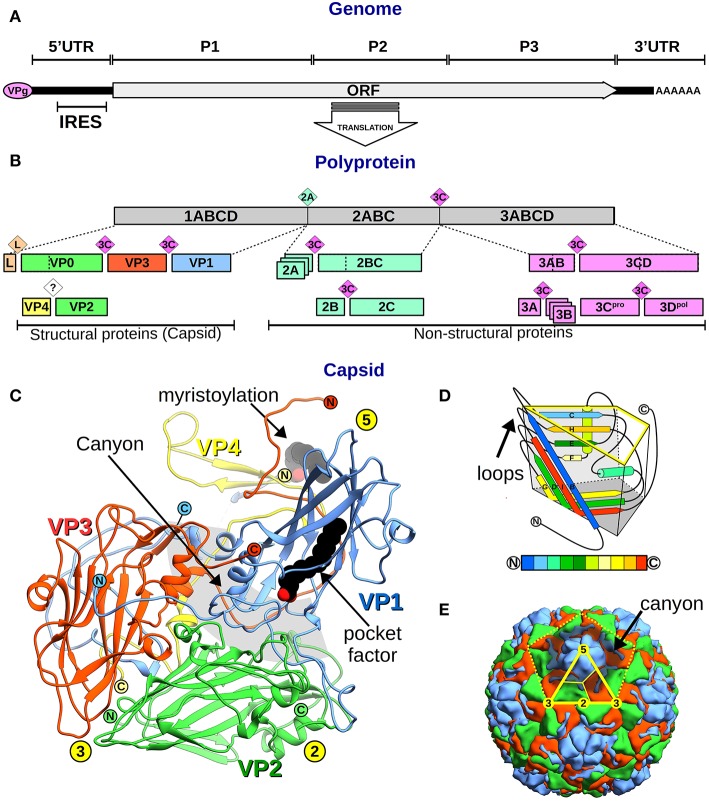
Figure 1.
Picornavirus genome, proteins, and capsid organization. (A) Representation of the picornavirus genome, the VPg, and the polyA tail, showing the single ORF location. The position of the P1–3 regions, the flanking 5′ and 3′UTR, and the IRES are indicated. (B) A bar diagram showing the polyprotein (gray box) and the proteolytic cascade that leads to all picornaviral proteins (colored boxes). Boxes include the protein names following the genome-ORF regions' nomenclature (number–letters) or the VP1–4 nomenclature for the structural proteins. Colored rhombi indicate cleavage points and are labeled with the corresponding protease name. (C) Overall view of the canonical picornavirus protomer with the proteins VP1 (blue), VP2 (green), VP3 (red), and VP4 (yellow). The protein N- and C-termini are indicated as encircled N and C letters, and yellow circles show the 5-,−3, 2-fold symmetry axes positions. Lipid components as the VP4 myristoylation and the “pocket factor” are depicted as black spheres. The “canyon” region is shown as a gray circular segment shadow. (D) Schematics of the “jelly roll” fold of VP1–3 proteins inscribed in a trapezoidal prism where the yellow highlighted face corresponds to the external capsid surface, and the dark gray base faces the inner capsid. The secondary structure elements are colored from N- to C-terminus according to the color code bar below. External loops and N- and C-terminus are indicated. (E) Overall view of the picornavirus capsid showing the outer surface of VP1 (blue), VP2 (green), and VP3 (red). The yellow dotted line indicates the boundaries of one pentamer. The solid yellow line marks the icosahedral asymmetric subunit and thinner lines separate proteins following the trapezoidal schematics shown in (D). Symmetry 5-, 3-, 2-fold symmetry axes are indicated in yellow circles.

