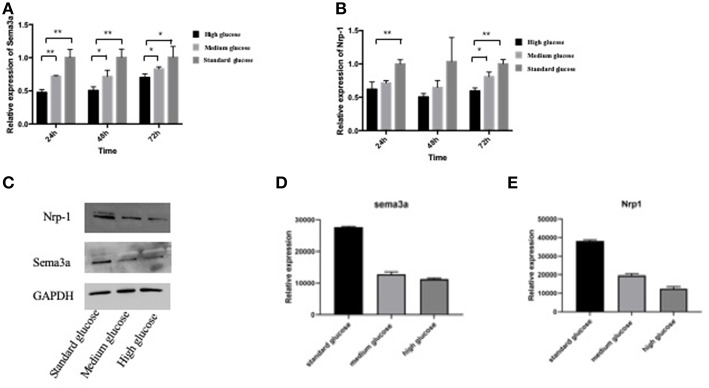
Figure 2.
The mRNA expression of sema3a (A) and Nrp-1 (B) of MC3T3 cultured in different medium at 24, 48, and 72 h. (C) The Western Blot of sema3a and Nrp-1. The quantification analysis of the Western Blot of sema3a (D) and Nrp-1 (E). The medium is high, medium and standard glucose DMEM, and the glucose concentration is 25.0, 15.25, and 5.5 mmol/L, respectively. Columns show the mean results of experiments carried out with triplicate; bar = SD. *P < 0.05, **P < 0.01.

