Figure 4.
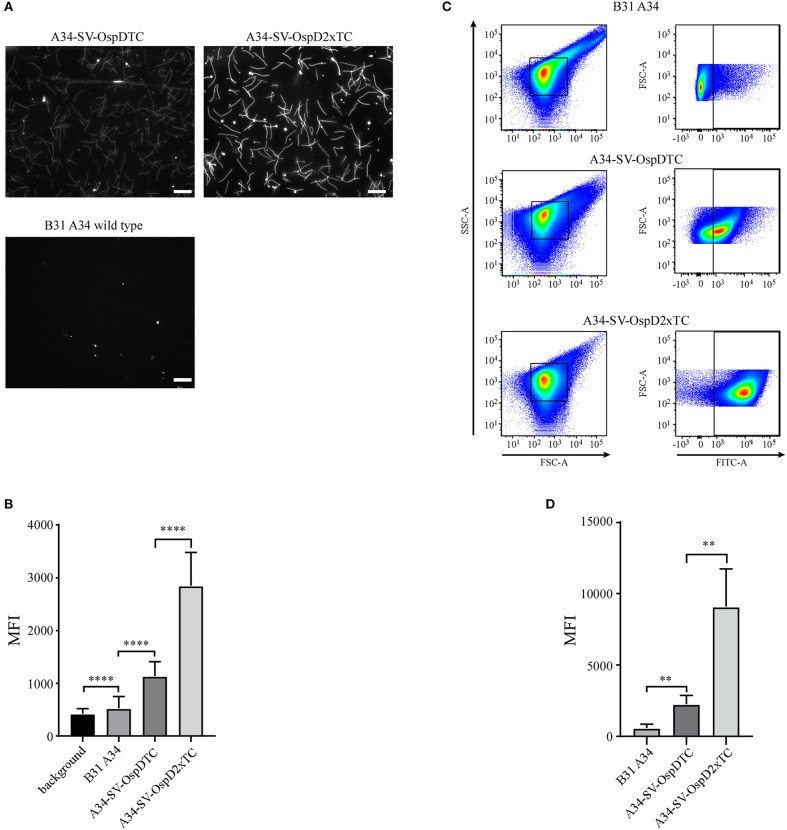
Optimization and quantification of the FlAsH dye system for B. burgdorferi membrane proteins containing tetracysteine (TC) motifs. (A) Spirochetes bearing OspD with two tetracysteine motifs fluoresce more brightly than those carrying OspD with a single TC tag. Unmodified B. burgdorferi strain B31 A34 does not fluoresce in the presence of FlAsH dye, but addition of a single tetracysteine-tag to OspD (A34-SV-OspDTC) allows FlAsH binding and fluorescence. Addition of a second tetracysteine motif to OspD (A34-SV-OspD2xTC) further increases fluorescence. All images were captured with identical exposure times and not inverted. Scale bar = 10 μm. (B) Quantification of differences in relative fluorescence of B. burgdorferi strains by microscopy. Addition of a second tetracysteine motif on OspD significantly increased fluorescence intensity (A34-SV-OspDTC 1,136 ± 272.3 MFI vs. A34-SV-OspD2xTC 2,850 ± 628.5 MFI, Mann-Whitney test p < 0.0001). Background in areas where there were no spirochetes, as well as of B. burgdorferi cells lacking tetracysteine motifs, were 421.1 ± 95.95 MFI and 524 ± 225.6 MFI, respectively. Individual spirochete fluorescence was quantified using Nikon Elements software version 4.2 and compiled to generate an average fluorescence per strain. Mean Fluorescence Intensity = MFI. Standard deviation is depicted by error bars (****) P < 0.0001. (C) Detection and differentiation of FlAsH-labeled spirochetes containing a single or double tetracysteine motif by flow cytometry. Addition of a second tetracysteine motif on OspD significantly increased fluorescence intensity (geometric mean for A34-SV-OspDTC 2,247 ± 603.5 MFI vs. A34-SV-OspD2xTC 9,079 ± 2,648 MFI, p < 0.0079). FSC-A, forward scatter; SSC-A, side-scatter; FITC-A, measure of fluorescence-intensity. (D) Quantification of the geometric mean data from 5 independent flow cytometer runs analyzed in Prism for statistical significance. Mean Fluorescence Intensity = MFI. Standard deviation is depicted by the error bars (**) P < 0.008.

