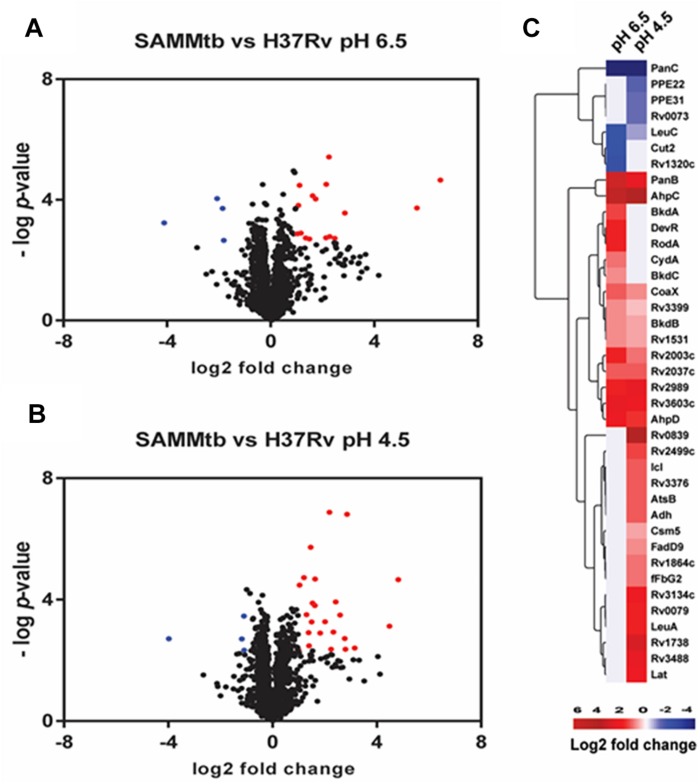
FIGURE 3.
Proteomic comparison of M. tuberculosis H37Rv and M. tuberculosisΔleuDΔpanCD under physiological in vitro growth conditions and in response to acid stress. Volcano plot showing protein expression differences between M. tuberculosis H37Rv compared to M. tuberculosisΔleuDΔpanCD when grown at pH 6.5 (A) and pH 4.5 (B). Blue corresponds to proteins with <-1 log2 fold differential expression and adjusted p < 0.05. Red corresponds to proteins with > 1 log2 fold differential expression and adjusted p < 0.05. (C) Heatmap of log2 fold changes of proteins showing statistically significant regulation between M. tuberculosis H37Rv and M. tuberculosisΔleuDΔpanCD during growth at pH 6.5 and pH 4.5.

