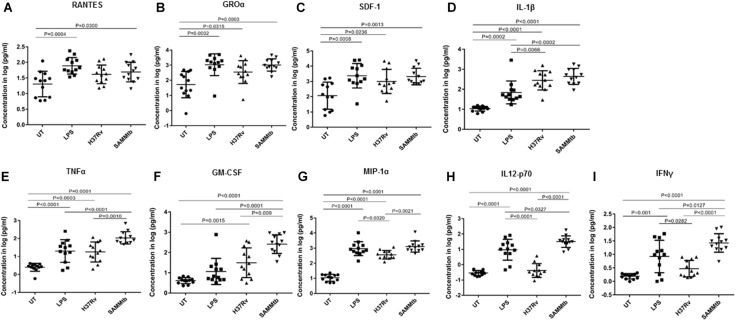
FIGURE 5.
Cytokine secretion in response to M. tuberculosisΔleuDΔpanCD and M. tuberculosis H37Rv. Cytokine release was assessed by Luminex analyses of supernatants from PBMCs. Cells were seeded at 5 × 10⁵ cells per well in a 48 well plate and infected with M. tuberculosisΔleuDΔpanCD and M. tuberculosis H37Rv (MOI 10:1) for 24 h. (A) RANTES, (B) Groα, (C) SDF-1, (D) IL-1β, (E) TNFα, (F) GM-CSF, (G) MIP-1α, (H) IL12-p70, (I) IFNγ. Lipopolysaccharide (LPS, 10 μg/ml)-stimulated and uninfected cells were included as controls. Supernatants were analyzed by multiplex assays using the Bio-Plex platform. The log-transformed data were analyzed using a one-way ANOVA with a Tukey Honest Significant Differences (HSD) post hoc test. A p < 0.05 was regarded as significantly different. All experiments were performed in technical triplicates.

