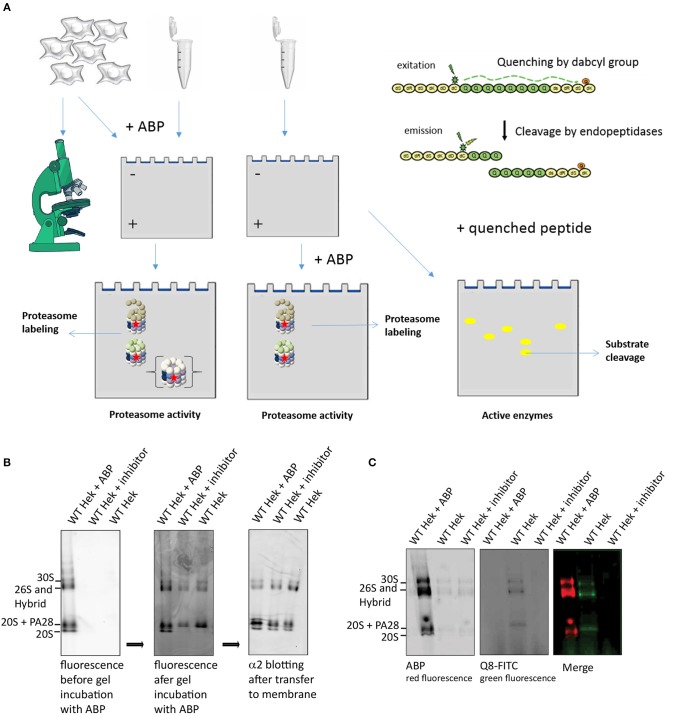
Figure 5.
Proteasome activity labeling in gel. (A) A schematic representation of methods to visualize proteasome activity, either by microscopy or by in gel visualization. The left panel represents methods to detect ABP labeling and the right panel explains the use of quenched substrates to determine proteasome specificity. (B) Proteasome labeling in gel. HEK293 cell lysate was divided in three fractions, one fraction was pre-incubated with ABP4 for identification of proteasome complexes, one fraction was pre-incubated with proteasome inhibitor to determine specificity and one sample was left untreated. Upon complex separation by a 3–12% native gradient gel, the wet gel slabs were scanned for fluorescence (left panel). Subsequently, the gel was incubated with buffer containing ABP4 and again scanned for fluorescence (middle panel). After protein transfer to a PVDF membrane, α2-antibodies confirmed the presence of all proteasome complexes in each lysate. Differences in proteasome labeling were observed between the lysates, since in gel labeling only revealed proteasomes capped with a proteasome activator. (C) Quenched peptide substrates to determine proteasome specificity in gel. HEK293 cell lysates were divided in three fractions, one fraction was pre-incubated with ABP4 for identification of proteasome complexes, one sample was left untreated and one fraction was pre-incubated with proteasome inhibitor to determine specificity of the fluorescent degradation signal. After complex separation in the gel, the gel was incubated in buffer containing quenched polyglutamine peptides (Q8-FITC) that become fluorescent after cleavage. Merging the two images shows a proteasome cleavage pattern of the Q8-peptide.

