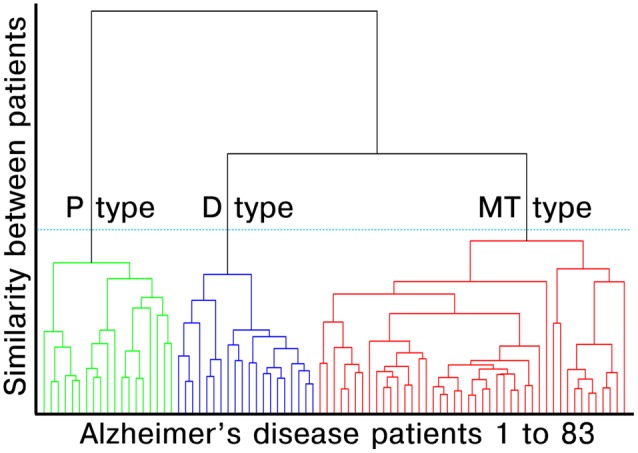
Figure 1.

Dendrogram created by surface-based multimodal cluster analysis. AD, Alzheimer’s disease; MT, medial temporal-dominant; P, Parietal-dominant; D, Diffuse atrophy. The distance along the y-axis represents the measure of similarity between patients, such that the shorter the distance, the greater the similarity between patients. The green, blue and red lines represent the clustered subtypes of AD dementia. The three clusters were selected based on Gap statistics (see Appendix 2 in Supplementary Materials).
