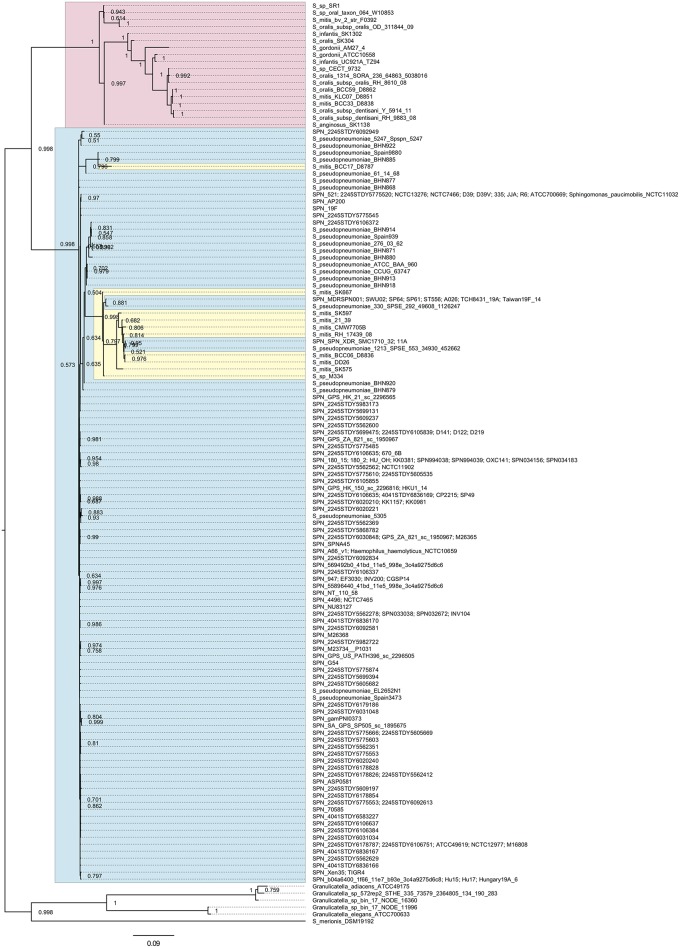
Figure 1.
Bayesian phylogenetic analysis of the pfbA gene. The codon-based Bayesian phylogenetic relationship was calculated using the MrBayes program. Strains with identical sequences are listed on the same branch. S. pneumoniae and S. pseudopneumoniae pfbA genes are shaded in cyan. Other mitis group bacterial pfbA genes are shaded in magenta. S. mitis pfbA genes among S. pneumoniae are shaded in yellow. The posterior probabilities are shown near the nodes. The scale bar indicates nucleotide substitutions per site.

